

")
Most often, a good trend can be visually observed on the chart. But an experienced trader must clearly understand the current balance of forces in the market before entering. The trend strength indicators are the ones that help to assess the potential danger of market players: if you're not in the market – whether or not you should enter, if the transaction is in the work – the optimal point of closure.
Proper assessment of trends allows to "catch the wave" – enter at the beginning of a trend, wait over a minor correction and close the position at the end with the maximum profit. These tools in fact are simple indicators of trading demand/volumes. A trend line is a price result of the struggle between the sellers/buyers, and trend strength indicators allow to perform a comprehensive assessment of the market (Direction+Volume+Volatility+PositioningOfPlayers) to predict the future movement based on the real trading intentions of the participants.
Mathematics of the indicators
There are current market measurements on Forex that can be considered completely accurate, i.e. independent of the timeframe, and the volume weighted average market price is one of them. Therefore, the so-called Trend strength is characterized by the trading volume, direction and price range (volatility). If the closing price (of the most positions) exceeds the previous one, the strength of the trend is positive, otherwise it is negative. And the greater the range of price changes, the stronger the trend is considered.
The value of the trend strength indicators is the difference between the current and the previous prices multiplied by the total trading volume. Traditional options for indicators build lines (or histograms) around the central zero line and the range (-100 to +100): a positive (bullish) signal above the line, a negative (bearish) below the line. Without changes in the price, the indicator will fall along the baseline.
To calculate the trend strength, you need to set a choice in the indicator:
- Method of the moving average;
- The number of calculation periods;
- Method for determining the sensitivity;
- Selection of time intervals to verify the calculation.
Indicators have a tough bind to the moving average, as it is believed that the average means the current market balance. Assessment of the current max/min prices in relation to the average price shows how the bulls or the bears managed to shatter the market in their favor.
Types of the trend strength indicators
The simplest example: BullsPower and BearsPower, which are included in the MetaTrader standard set. It is recommended to use them simultaneously:
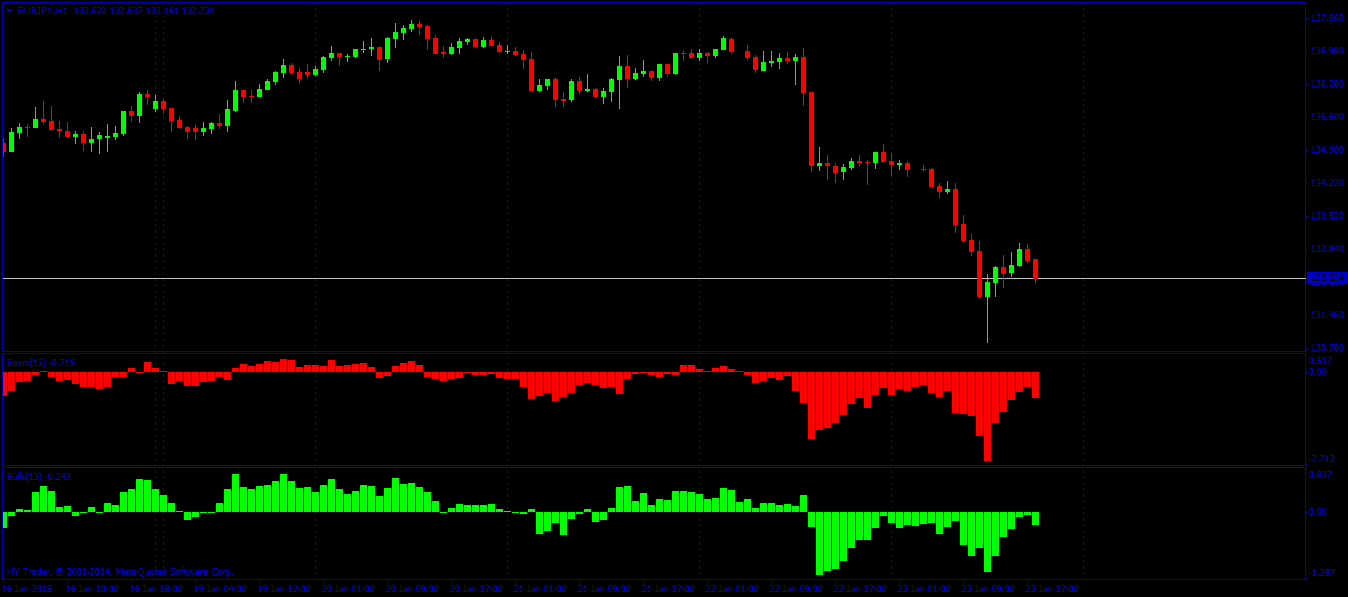
The indicators may be visually implemented as:
- Oscillator;
- Signal.
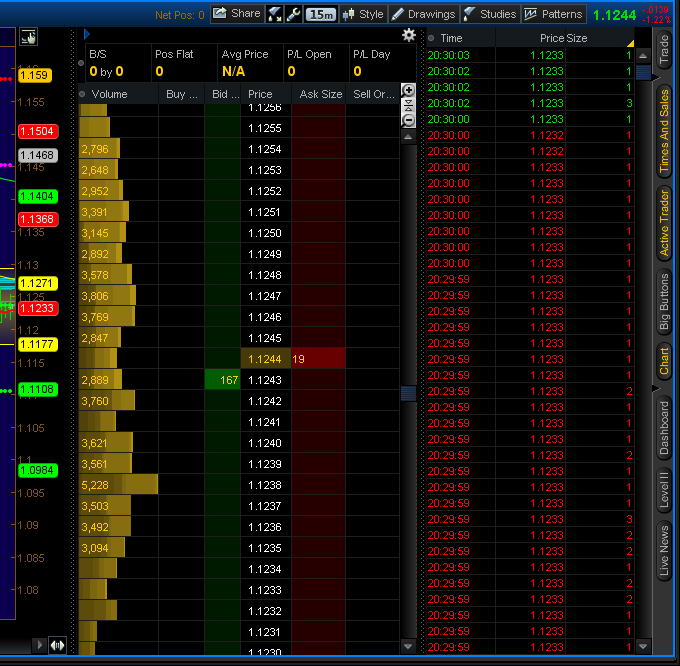
The trade blotter should be mentioned separately. Such trading platforms as Thinkorswim, Ninja and ClasterDelta have access to information about placing orders on leading stock exchanges and display them in real time directly in the working terminal. There are special indicators for these systems, but the trend strength as a result of the bulls/bears struggle can be assessed visually by observing the amount of the open and pending orders.
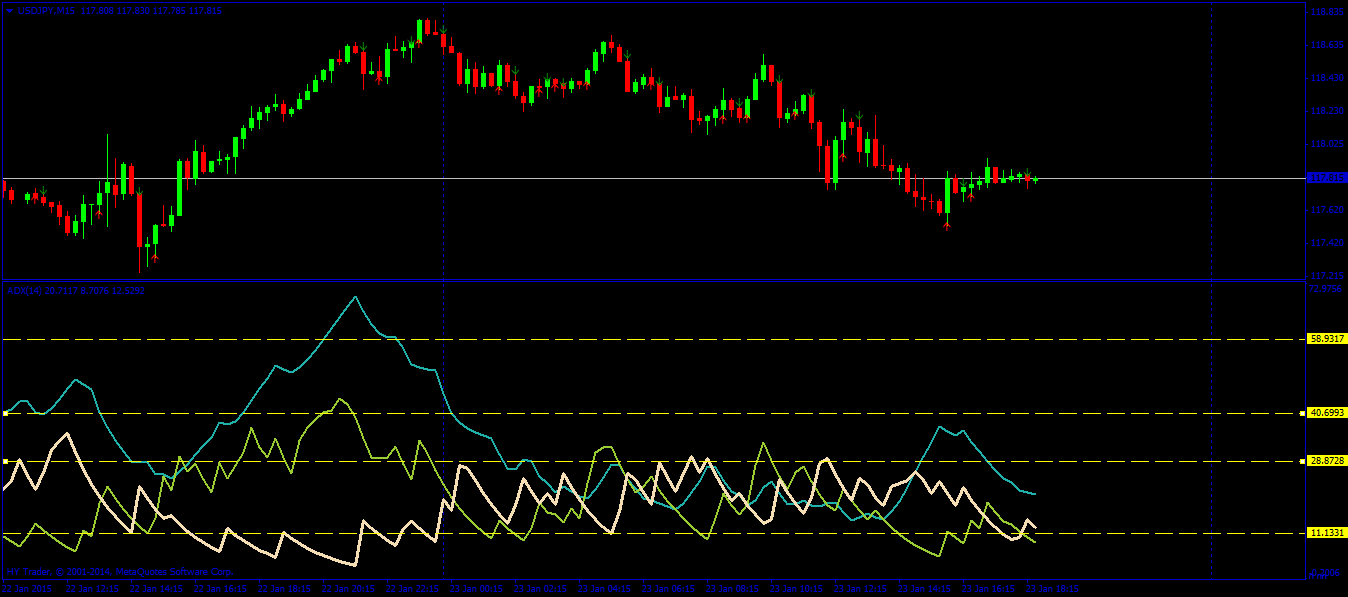
Oscillator
The most accurate and popular indicators of this type are considered to be variants of the Average Directional Movement Index (ADX) indicator, which display three lines in the additional window: (+Di) or (+DMi) shows the strength of the players for a rise (bulls), (-Di) or (-DMi) are active players for a fall (bears), and a full line of trend strength without specific direction. ADX algorithm helps to see the point of the trend origin after a period of flat. The division of the window by the percentage ranges indicates overbought/oversold levels.
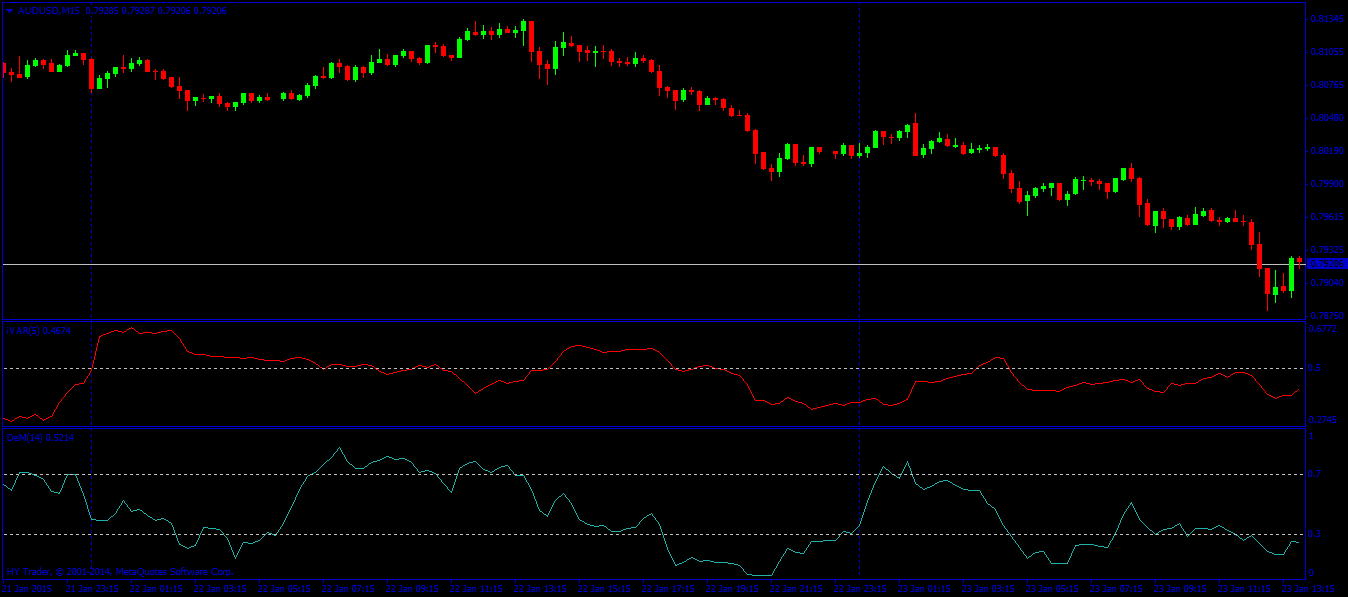
There is a family of indicators of "variations" that assess how strong the trend is at a given moment; an Ivar indicator is an example: the line is built under the price chart that "revolves" around the balance line 0.5. Famous DeMarker Indicator works somewhat similarly in the range from 0 to 1.
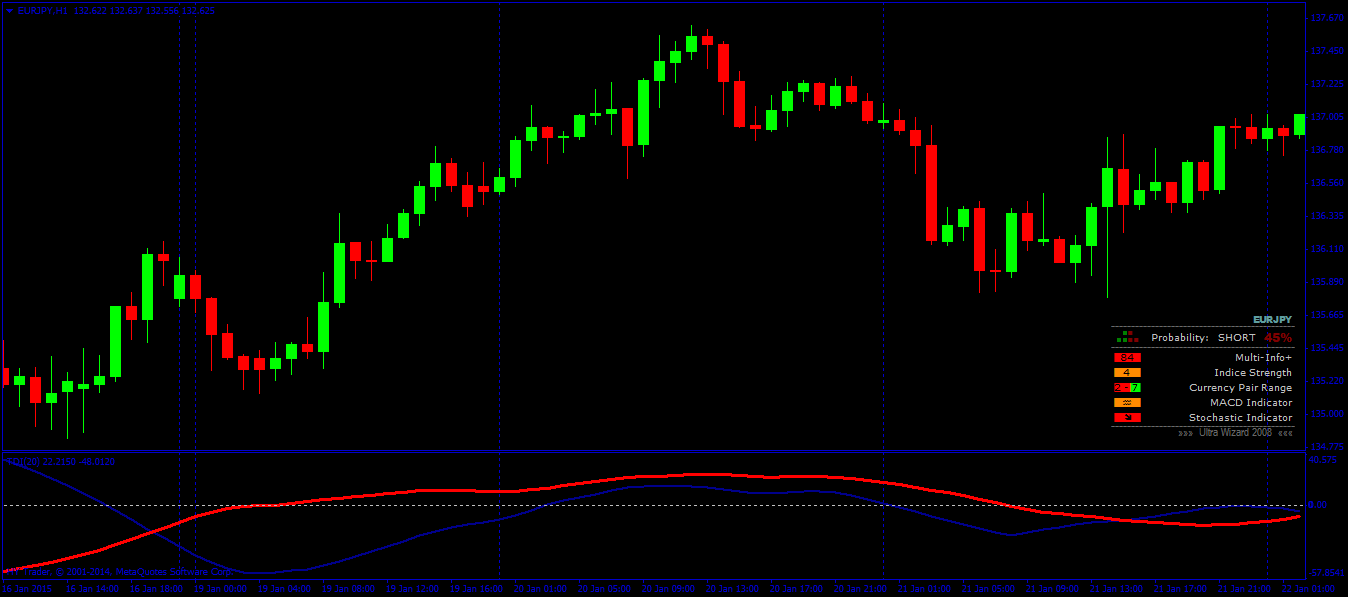
Complex indicators, like UltraWizard, conduct technical analysis based on the readings of several indicators (MACD, Stochastic, etc.) and show the trend direction and its strength.
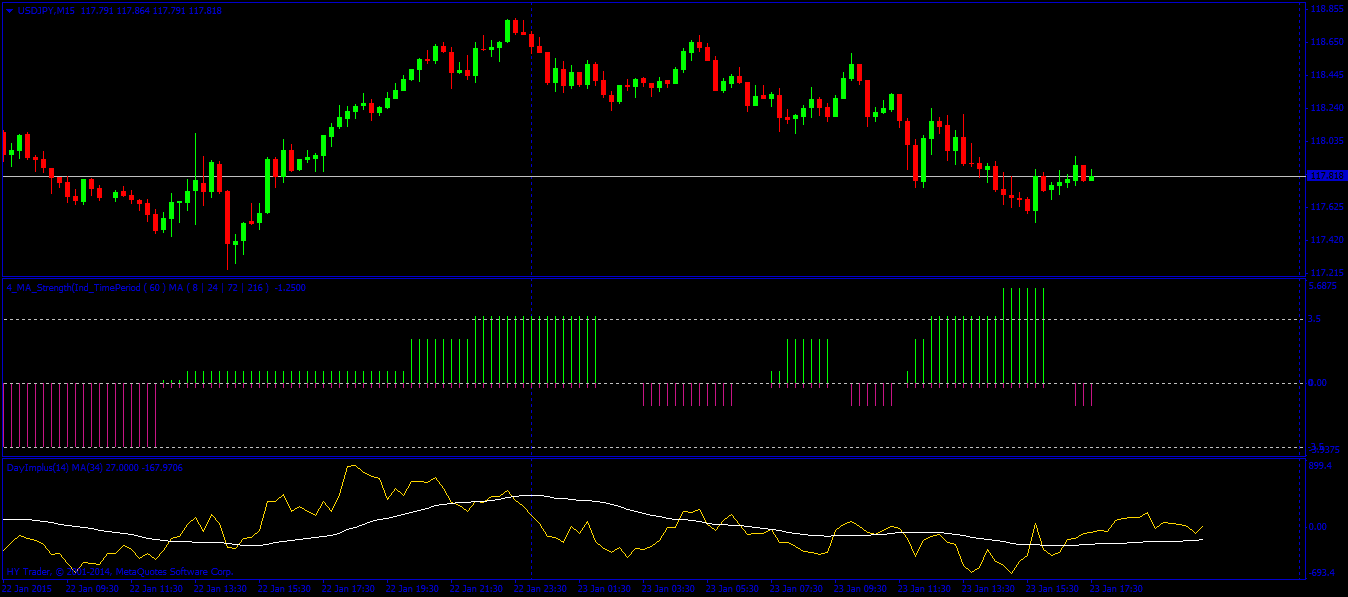
The next most popular indicator Force Index was developed by A. Elder and measures separately the strength of the bulls and bears. It is commonly used bundled with trend indicators, because it lags quite a lot.
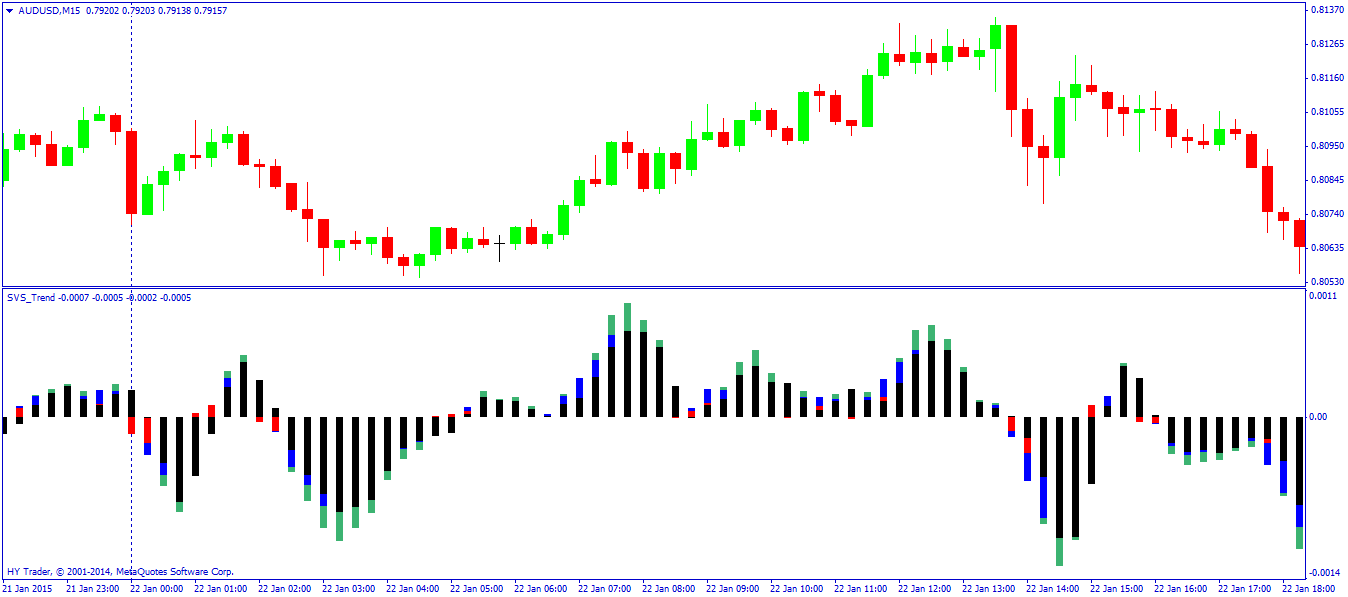
Another indicator that we would like to note is SVS_Trend. Its algorithm processes the four different periods and displays the histogram of different colors. It shows overbought/oversold areas well.
The versions of the pulse indicator Aroon are also successfully used to assess the trend strength:

Signal
Typical representatives of this type of the trend strength indicators are the tools which resulting data is displayed as a colored bar (or numerical values), depending on the strength of the movement of each currency at a certain scale. The higher and brighter the color, the stronger the current movement of the asset.
The indicators of the "mood" on many websites work somewhat similarly (e.g. OANDA), and a multi-indicator Alpha can be an example for MetaTrader 4(5), which gets data from the server (or several of them) on placing orders and shows the "color" and the strength of the short-term trend for each asset. The trend strength in terms of sustainability is shown as a number with a maximum value of 100 (Trend Strength Index or TSI). The higher the number, the more reliable the trend was at the opening of the bar.
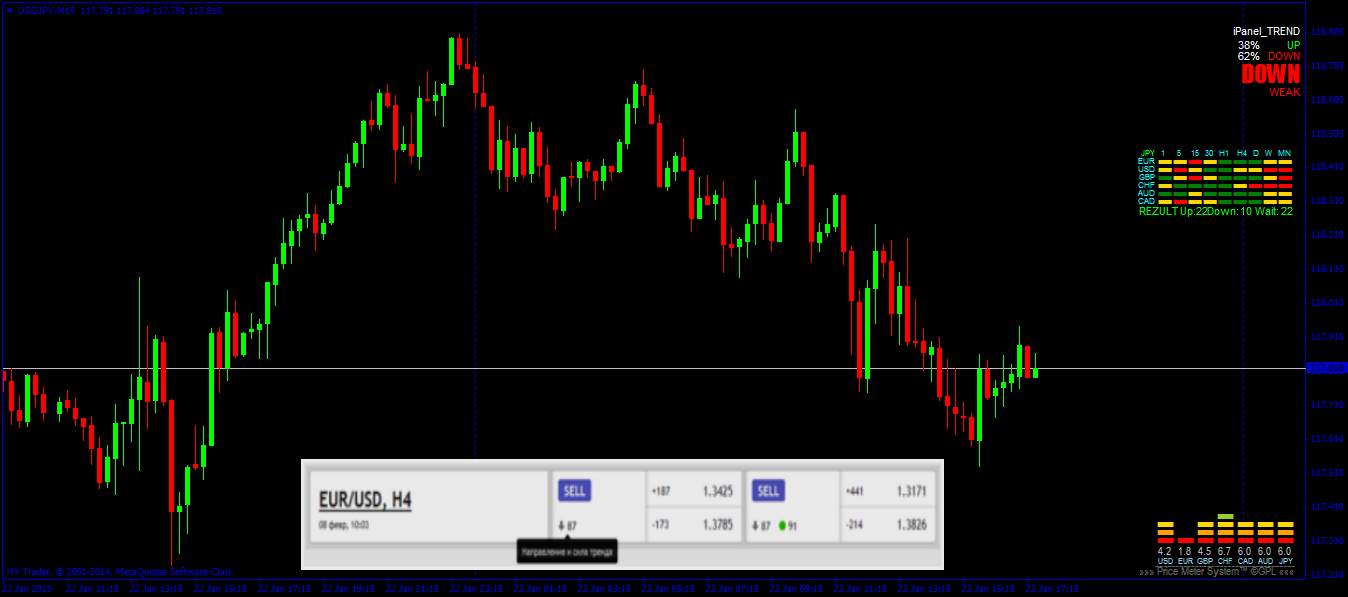
The percentage options for trend strength indicators are also offered – for example, iPanel Trend: it shows the leading trend and a likelihood that it will continue as a percentage. It also adds a comment for the thick: “WEAK” or “STRONG”.
Use in trading
For scalpers: application of the trend strength indicators allows to assess the volatility of the current tool and the possibility of short-term deals both by the trend and within range.
To trade by the trend: when combined with any trend indicator, the indicators of falling volumes and lower demand are harbingers of a reversal.
Indicators can be used independently, but it is better to complete them with moving averages. Smoothing the moving on small periods is used to find the moments of entry/closing. On a longer period, the average monitors changes in the balance of power between bulls/bears.
And as a conclusion...
The main purpose of calculations of the trend strength indicators is to assess the current price of the asset with some averaged mean value. Regardless of how such indicators are implemented, their signals and data must show an estimate of the strength of the players in both directions, the resulting direction, duration and possible "attenuation" of the current trend, i.e. reversal points.
Remember that the market is a war, where the correct assessment of the strength of the enemy's intentions is half the battle.
Social button for Joomla