

")
You can often hear that the ultra-precise indicators are fantasy of the beginners who are searching for the "Holy Grail". In part, this is a true remark, because even an accurate indicator sometimes fails, but critics are not telling the whole story here, as such indicators do exist.
Before searching for reliable algorithms, you should take one simple fact as a given: all the errors in the indicator formulas are due to the time factor, it is clear even on an intuitive level in mathematical calculations you can’t equate two candles that are identical in duration, but with different price ranges (VSA method and graphical patterns are a different story, but today we will not review such strategies).
Consequently, the best indicators are algorithms where the time factor has the least impact on the result of calculation. This is an idea for you to start the search, and if you want to simplify it, let us consider a few examples of such models.
Ultra-precise indicators for regular charts
So, why were many traders disappointed in technical analysis? It's simple: the usual chart is built in the "price-time" coordinate system, so almost all of the standard indicators (Stochastics, MA, MACD, etc.) will be delayed on it, and it means that the speculator will only have indicators of volumes and different levels for precise entries.
Unfortunately, it is impossible to calculate the actual volume on the Forex market, so you have to work with so-called "tick data", but this is its main advantage, because the number of price fluctuations reflects trading activity, and thus allows to determine the imminent trend reversal in advance.
These ultra-precise indicators are standard any terminal and called Accumulation/Distribution and On Balance Volume. Yes, they are also bound to time, as they are designed to give an objective assessment of price volatility on each new candle, but the matter is that the divergence in the mentioned indicators allows to capture position before the crowd in the market sees the actual trend reversal.
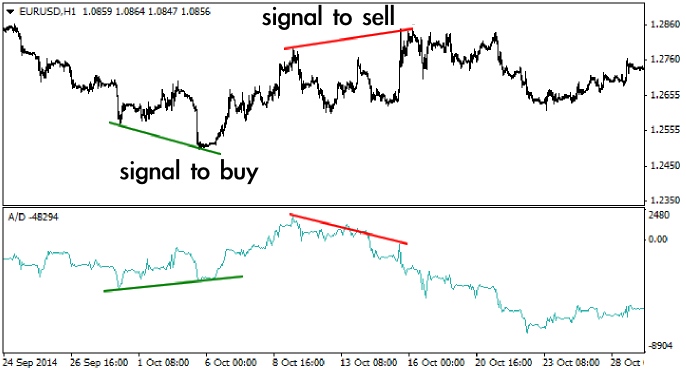
The above chart shows two classical cases of divergence between the A/D dynamics and quotations of EUR/USD pair. In the first case, a reliable buy signal arrived, as a new low of the indicator was higher than the previous one, while the European currency updated another low against the dollar. In the second case, there was a similar situation, but here the “smart” bears were the ones who started to capture position.
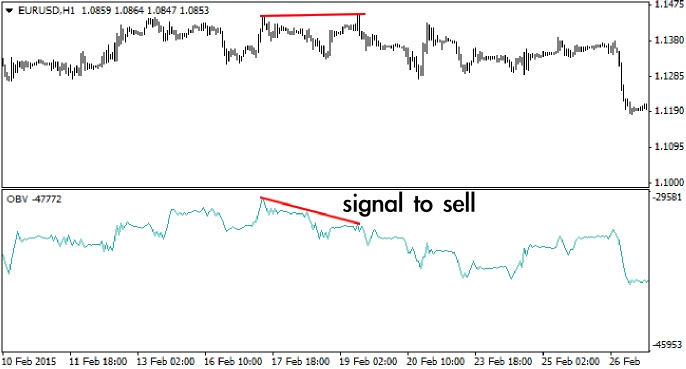
According to our observations, OBV indicator is less sensitive to changes in the balance of market forces, but it also generates good signals to buy and sell just before a reversal momentum. We can bring another divergence on EUR/USD as an example:
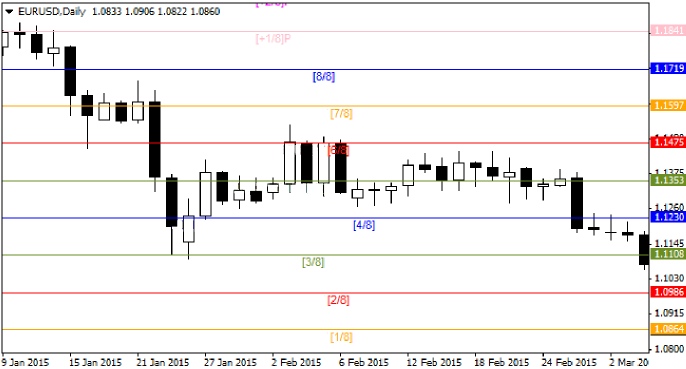
As for the indicators of level, the most accurate of them is the algorithm that builds Murray levels. It is noteworthy that the price rebounds from many levels (especially blue) – in most cases point to point, which makes them indispensable for both the forecasting purposes and stop-loss setting. In fairness, we should note that this topic deserves special attention, but today we won’t focus on it.
Ultra-precise indicators for Renko charts
Now let’s move to the most interesting part of today’s publication. We have previously studied Renko charts briefly, so today we will not consider the theory and the procedure of configuring Renko advisor in the MetaTrader terminal – we’ll rather go straight to the results of observations and tests.
We should recall that the main advantage of Renko charts is neutralization of the time factor, i.e. in the price bars are built considering only the fact of price movement, and the chart is represented as a sequence of "bricks" of equal magnitude.
As a result of this simple conversion, all of the standard formulas, especially oscillators, are modified into ultra-precise indicators. Talking the language of statistics, in this case, each element of the test series is given equal weight, so the result of the calculation is not distorted from period to period. Now let’s set Stochastic oscillator and RSI on Renko chart:
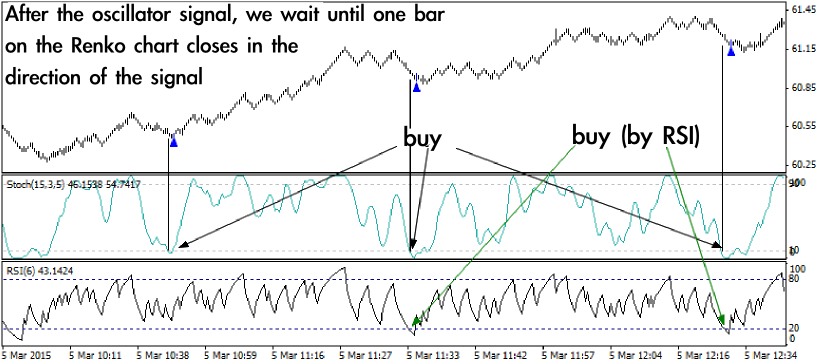
As you can see, the usual and long-known oscillators now appear in a completely new role – they actually do not delay and allow to accurately determine the optimal points for transactions. To be more specific, in this case the following situations may serve as signals:
- Touch by RSI or Stochastic line of the upper limit of its range is a recommendation to sell;
- Touch by indicators of the lower limit of the range is a signal to buy.
Renko chart plays the role of a filter of the false alarms – to open the order, the trader only needs to wait for the first "brick" directed towards the proposed transaction. This approach allows both to smooth the noise on the flat market and accelerate the response of the trading strategy to impulses.
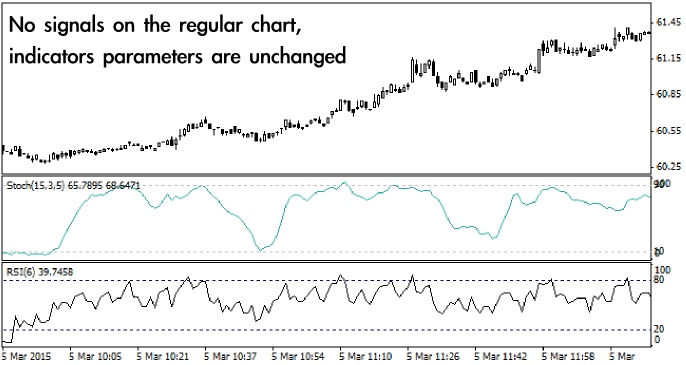
To make the feasibility of working on Renko more apparent, we can set the "fresh-baked" – or rather old, almost "rare"– ultra-precise indicators on the chart of the trading tool and find the same sector of the market. Actually, it is obvious from the figure even without comments:
We also can’t miss the moving averages. Certainly, many new traders have heard about their deficiencies, which fully appear in the trading strategies based on the intersection of the "fast" and "slow" MA, as well as methods based on Envelope indicator.
Similar remarks were absolutely fair and reasonable, but only before the appearance of the Renko charts that have transformed even such seemingly outdated methods into ultra-precise indicators. We don’t want to sound unfounded, so let’s set a regular envelope on Renko and compare it with the markup on the same section of the standard price chart:
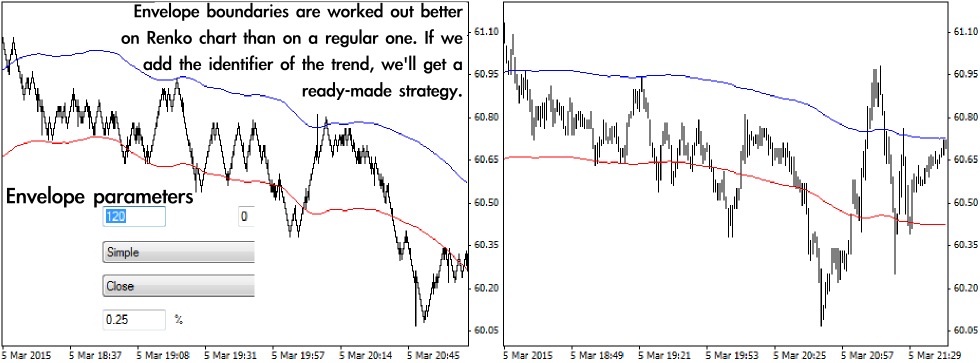
It can be seen that the price rebounds from the borders of the “bricks” with high accuracy, while the envelope significantly lags behind the real trend on a regular chart and therefore loses all meaning. How to use it? You can trade on a rebound from the borders in the direction of the trend.
Making conclusions: where to look for ultra-precise indicators
To summarize, we should note that there are no universal indicators today, which would guarantee a profit – on the contrary, such a state of things is contrary to the very nature of the market and economic laws, – but on the other hand, it is quite real to find algorithms for your strategy that would generate correct signals in 60% cases, you just need to flinch from the obsolete methods.
A striking example of this is Renko charts, which allow to create the ultra-precise indicators on elementary and long-known formulas. You can obtain no less interesting results by trading on the range bars and special modification of charts displaying candles even when there are no quotes (they just paint one tick equal to the last price).
Social button for Joomla