

")
Remembering the classical market truth, it is possible to consider that if «trend is my friend», then volatility is dangerous, but a very favorable partner in business. In case of reasonable use the volatility indicators allowing not only to earn effectively but also to leave from losses in time. We will consider several non-standard options.
«To catch» a trend right at the beginning − it is a great luck even for professionals, of course, if only you not the market maker and don't create this trend independently. The most part of the market time the price moves in the side direction, but the range of fluctuations can be sufficient to earn decently.
We will remind: volatility is a range of the change in price from a maximum to a minimum during the trading day, week or month. The volatility is higher, the range during the trade period is more. Of course, risks for open positions increase, but also opportunities for earnings will be more too.
Traditional analysis tools calculate historical volatility, that is the value of a standard deviation of a financial asset cost within some period, calculated on the basis of historical data. It means that trade signals of the corresponding indicators can be also late or be incorrect. It is possible to estimate approximately expected volatility with a certain risk level, on the assumption that the current market value of a financial instrument correctly reflects these risks.
Real, useful to the trader, volatility depends on the following factors:
- historical volatility − the higher it now, the higher, perhaps, will be expectations of rather future dynamics;
- political and economic situation (elections, publications of statistics, the general condition of the economy and other factors);
- asset liquidity (demand/offer) of the market − if the offer exceeds demand, the prices fall, and vice versa;
- the total amount of transactions and activity of speculation on a concrete asset.
- the behavior of the price in a zone of strong technological levels and population mean of market instability;
- trade mode (time of a trading session, day of the week).
All similar analysis tools aim to conclude the considered price movements in themselves according to the put algorithm. Though the operation mechanism of indicators isn't identical, there is one purpose at all: to offer the trader visual reference points of correctional or trend levels for an entrance to the market or maintenance of a position. Volatility value can be measured as in points as in percentage.
We will remind briefly standard volatility indicator versions.
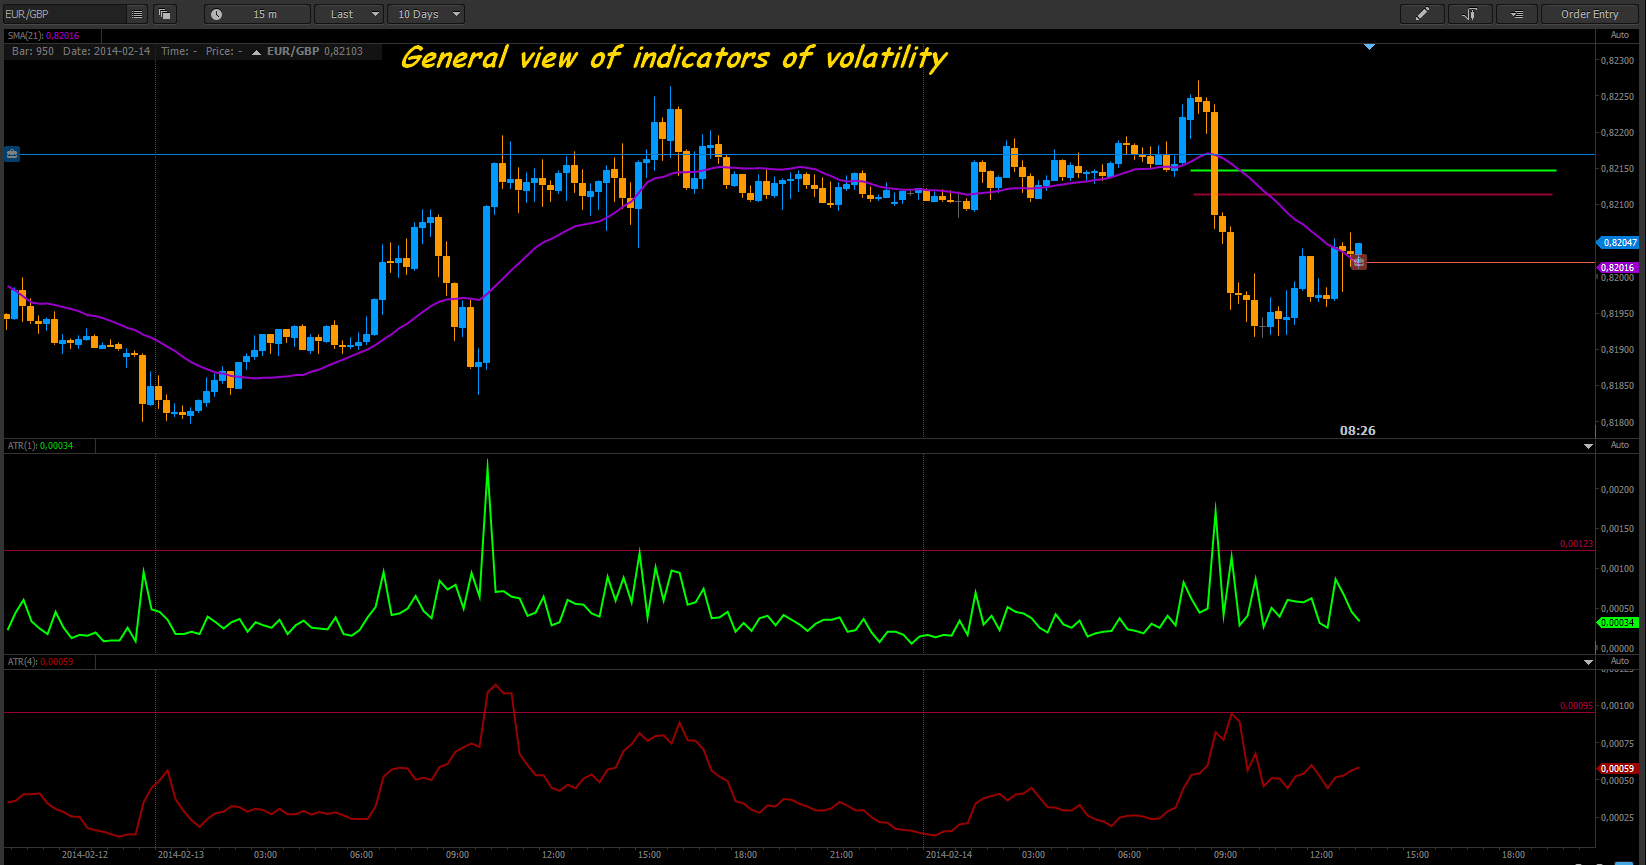
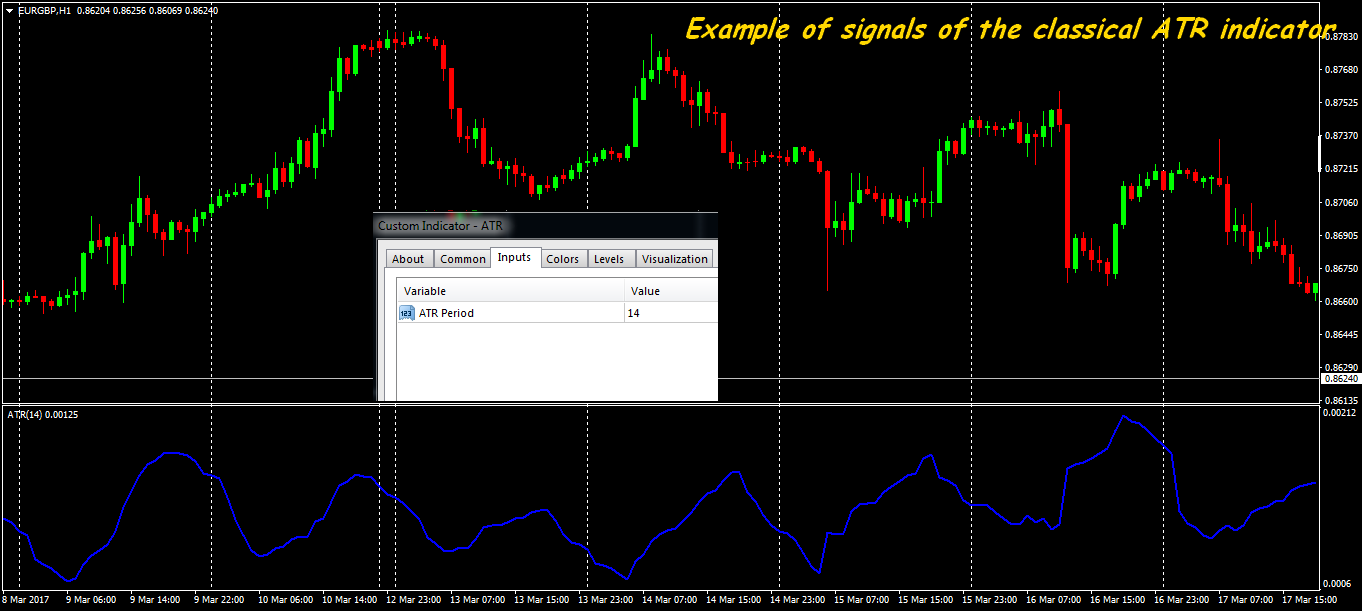
ATR: shows average volatility and it is used most often for installation of the purposes and stop losses. The value of the indicator is multiplied by some multiplier and thus calculate stop loss and/or take profit. At the same time, calculations will automatically change depending on the current volatility. The more volatility, the TakeProfit has to be bigger, volatility decreases − take profit have to be less.
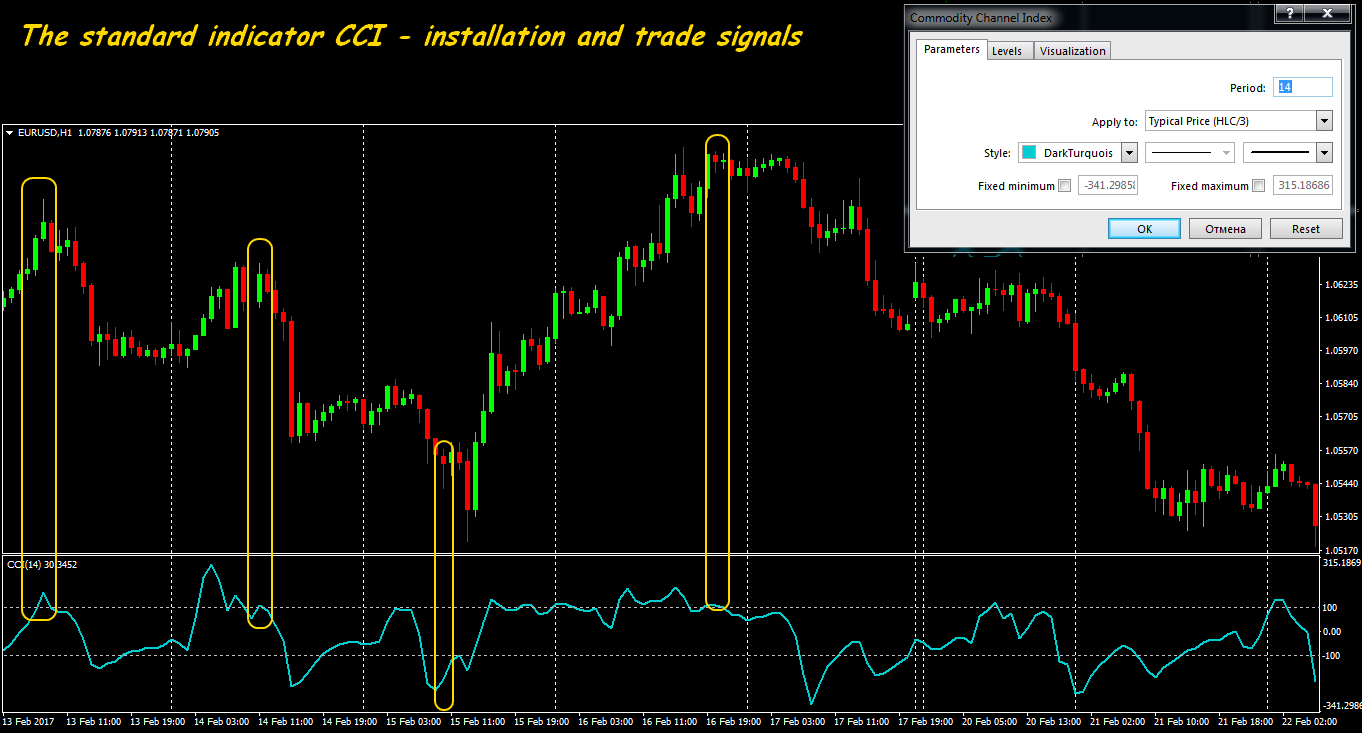
CCI: is based on data on the average price and moving average. It`s used as the oscillator: if the value is in a zone of an oversold it is recommended to buy, if in an overbought zone − to sell.
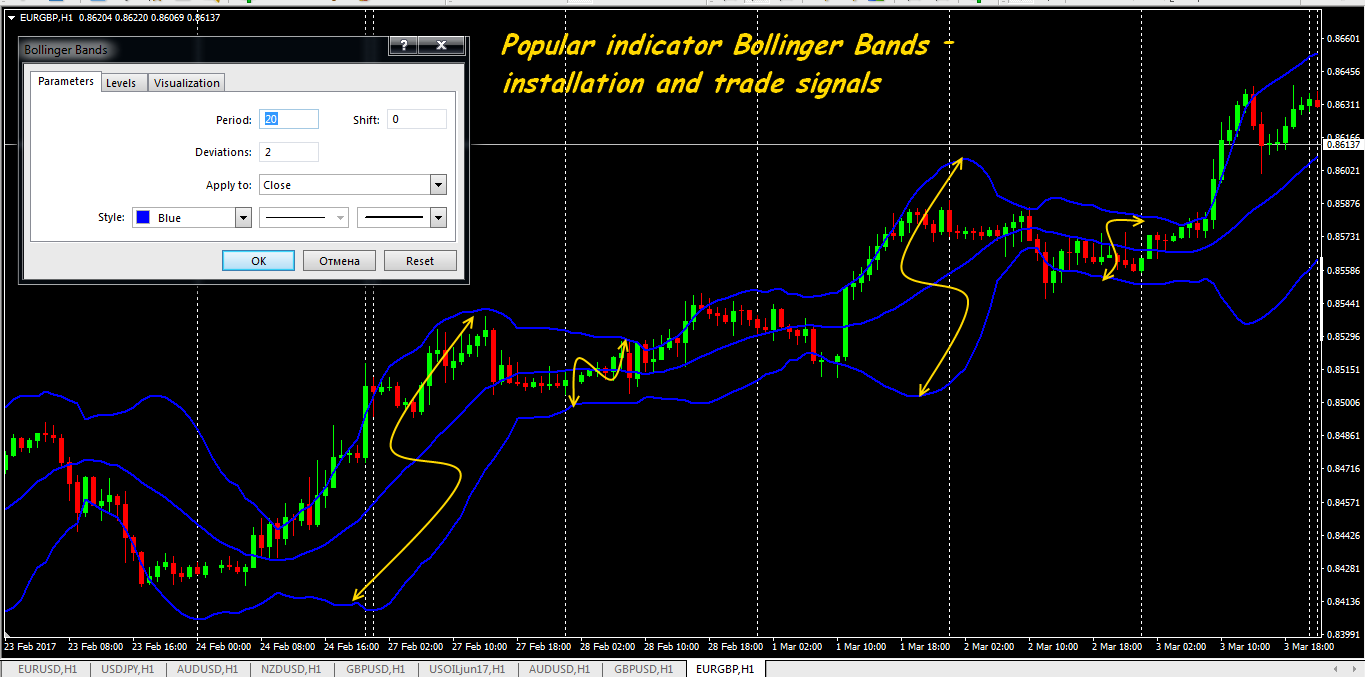
Bollinger's bands: standard moving averages and a standard deviation of the price parameter set. Are used most often for delimitation of the movement, to define the beginning and the end of the correctional movement.
Aroon: the advancing indicator for the definition of price extrema, the directions of the market and its ability to a turn. It isn't escaped even by insignificant price fluctuations and strengthening/weakening of a tendency within the time period: the indicator shows effectively all main conditions of the market, including price gaps.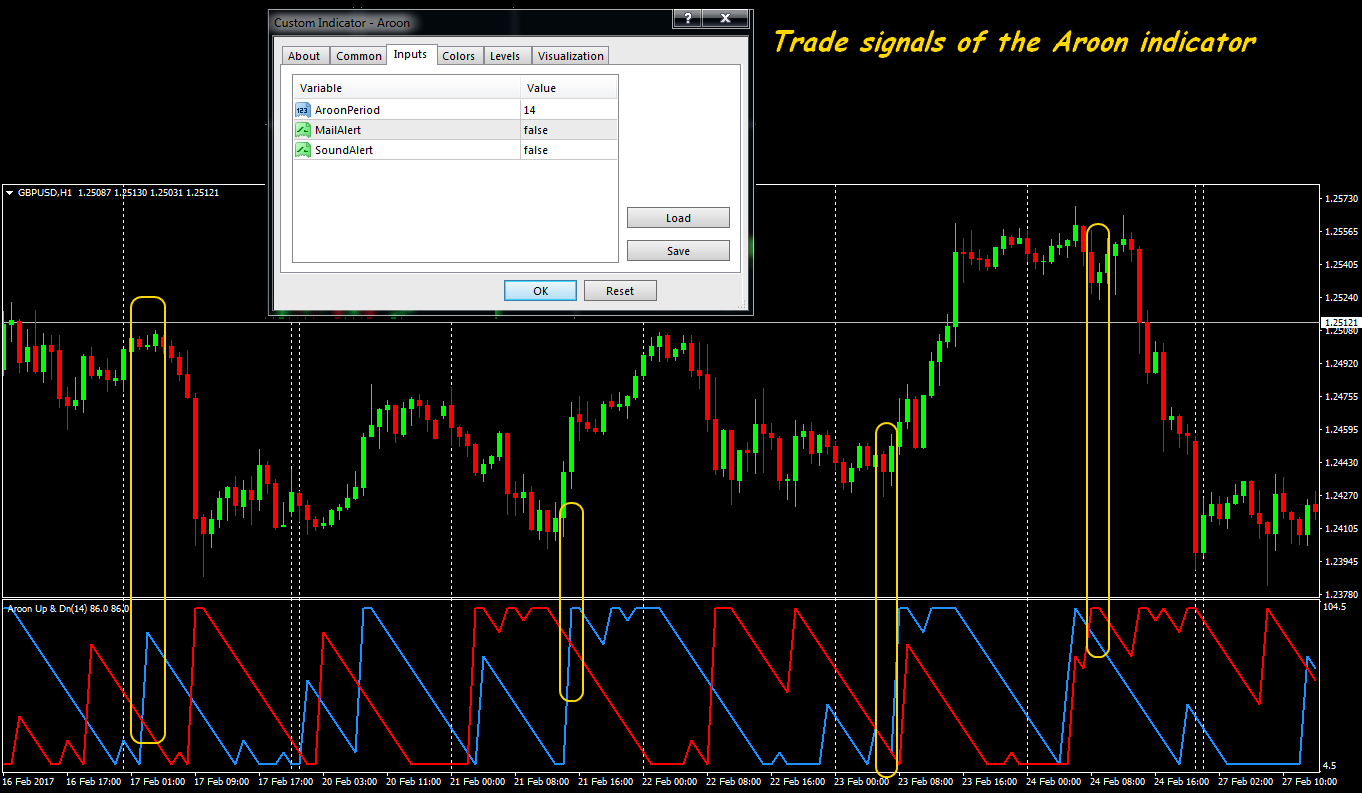
But ATR indicator, certainly, out of competition: we offer three working options on the basis of the standard version.
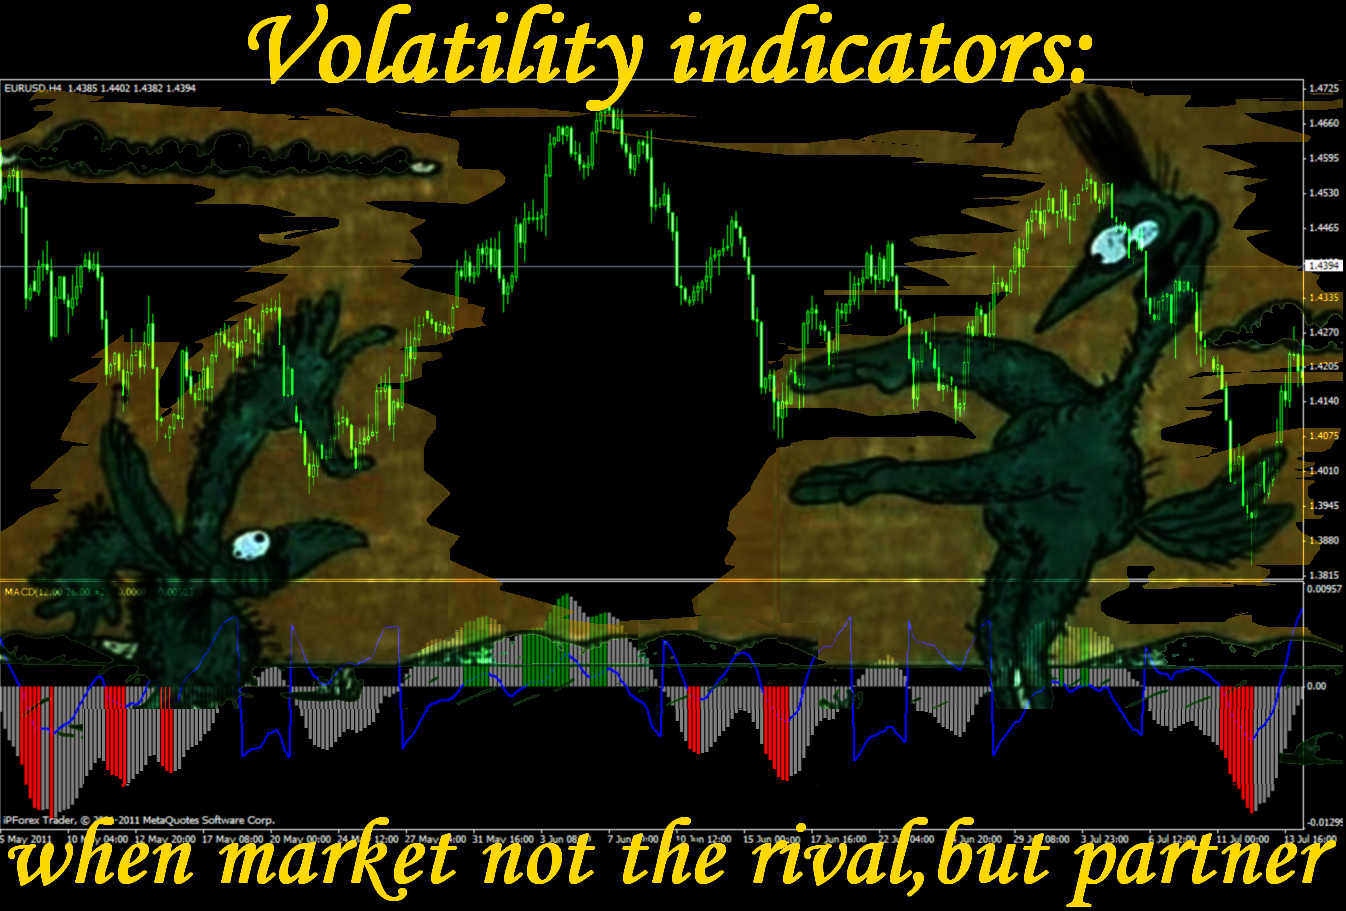
IMACD ATR indicator
The symbiosis of popular indicators is displayed in a separate window, using the same scale for the ATR lines and the MACD histogram. By default the histogram is gray, but at certain situations is painted in basic colors depending on the direction in the market − green and red.
The signals logic is simple: if the MACD histogram crosses the basic line and moves, for example, to a positive zone, then values of each column decrease by the size of the ATR indicator value, in the negative direction − increase by this size.
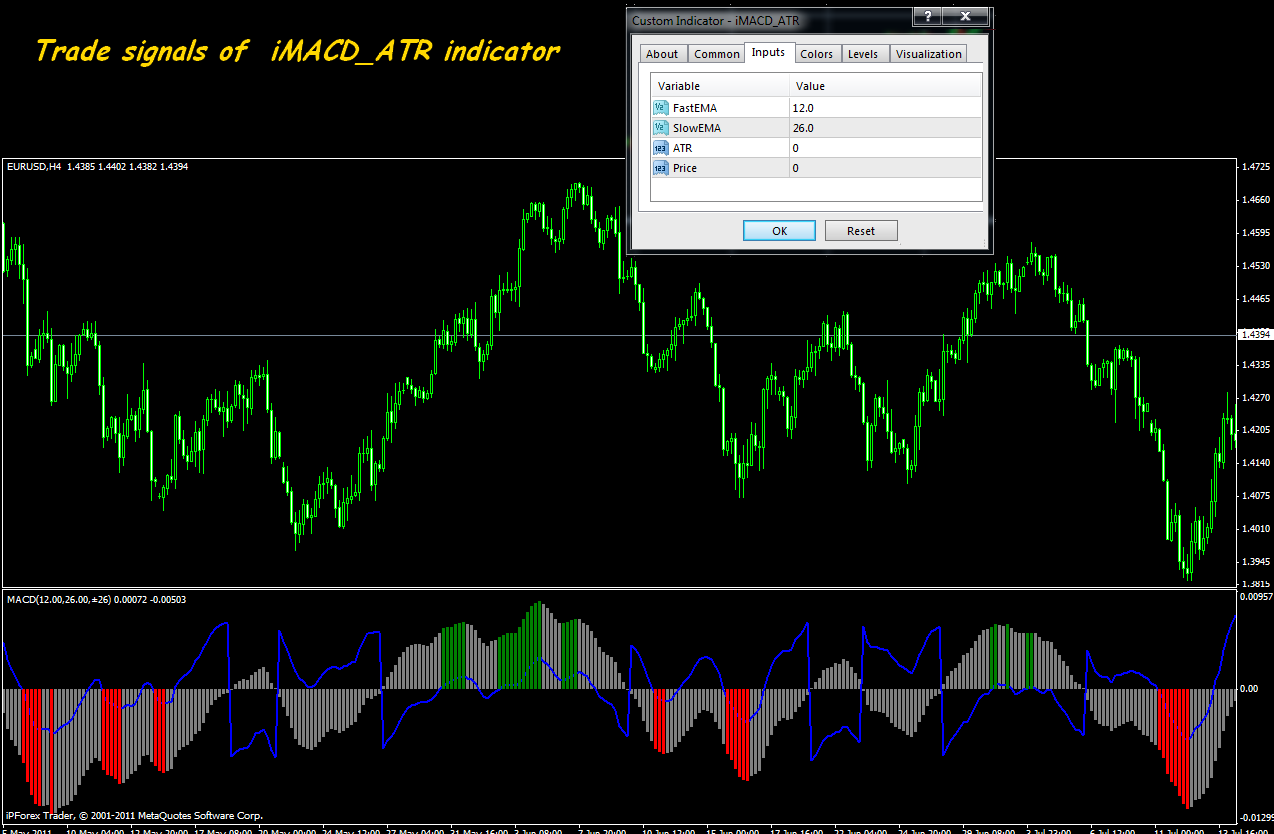
If MACD value is more than the value of trade range, then his histogram is painted in the necessary color. A set of parameters is similar to MACD, the resultant blue iMACD ATR line turns out MACD shift at a size ATR.
The trade signal on an entrance can be considered crossing the histogram by zero level (in the direction of crossing), and you may close at the first emergence of color columns (conservative approach) or at the emergence of gray columns after color (more aggressive).
LWMA ATR indicator
This is the option in which the method of smoothing of the average true range is changed. In the standard version, it is used simple smoothing, therefore, all piece of calculation is averaged equally. But the current volatility of an asset can change considerably in different trading days and even in different trading sessions. At high current volatility, the installation «too average» from the point of view of standard ATR stops /profits can be not favorable.
The LWMA ATR volatility indicator applies linearly weighed smoothing method, that is the last closed bars (the end of the range) have a greater influence on average value. Current volatility is so more precisely estimated that gives the chance not only for successful entrance but also the correct calculation of stop loss. In addition to the standard for ATR, Multiplier – adaptive coefficient for calculation of stop (value 1 = 100%) is added to a set of parameters.
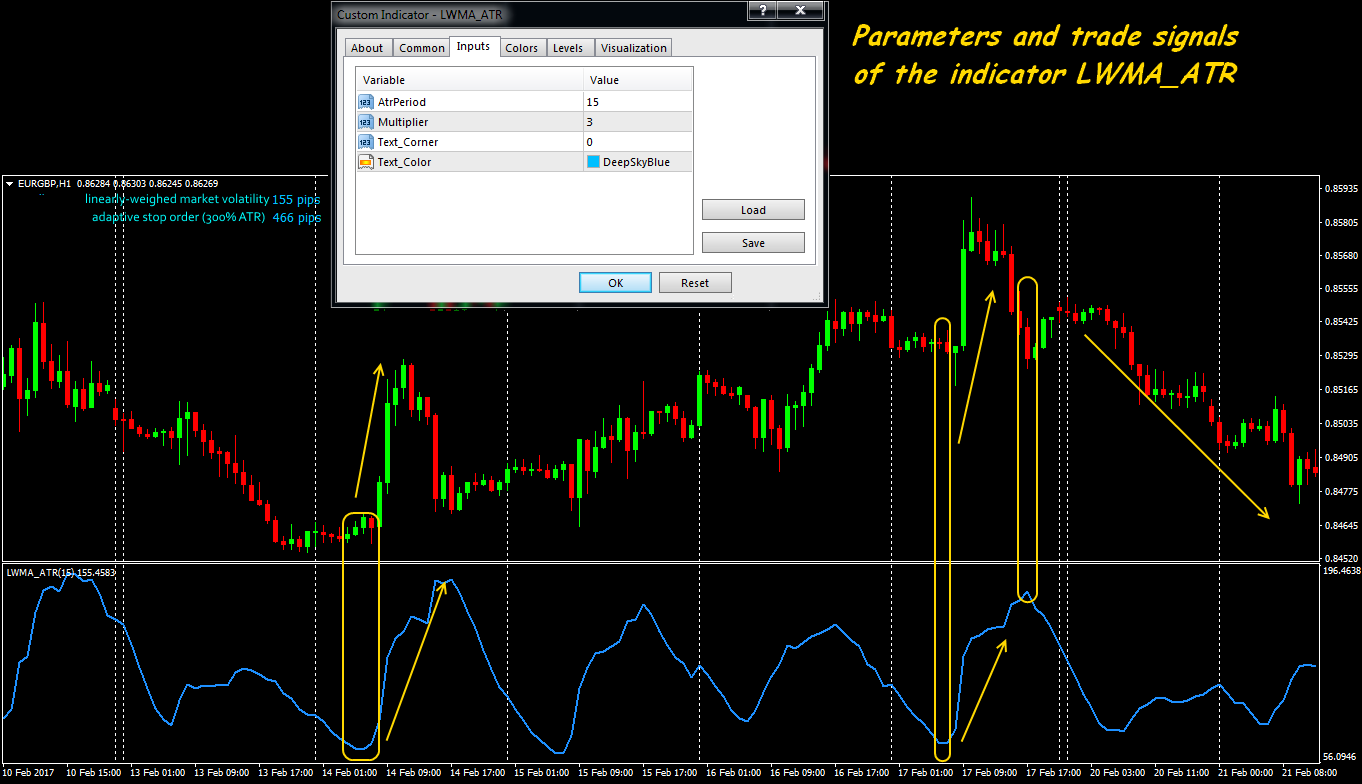
The LWMA ATR indicator doesn't give trade signals and can be used only as the global filter as a part of trade strategy.
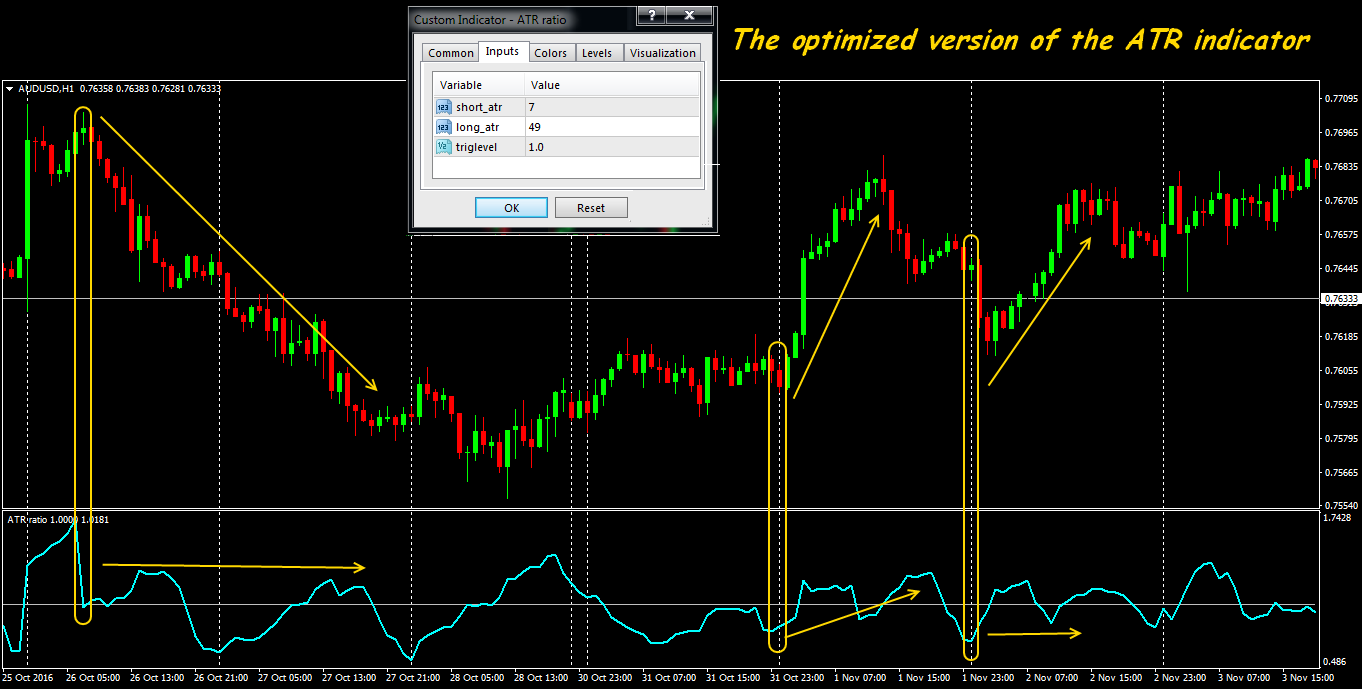
ATR Ratio indicator
This version of the indicator has been created for the more accurate filter of turn points. The indicator contains parameters for quickly ATR (short_atr), slow ATR (long_atr) and the basic line (triglevel). The indicator of ATR Ratio is the relation of values of quickly ATR (usually − with the period 7) to slow (49), and, therefore, short_atr value usually is selected multiple to long_atr.
In case of a sharp jump of the value, the indicator warns about forthcoming change of the current tendency. Low ATR Ratio values (less than 1) mean weak, and value reduction − the falling volatility. That is the entrance to transactions isn't recommended as there are no strong movements in the market (flat).
If the indicator grows and breakthrough the level 1, then it is considered that volatility grows and it is possible to open towards the movement of the price. The stronger the indicator grows, the trend turn is closer.
Even when using this indicator in complex trade strategy all values below of level 0.87 – are ignored. During such periods we look for trade signals on other indicators.
Further, we offer several popular combined volatility indicators.
Chaikin's indicator (Chaikin Volatility, CHV)
The author`s indicator calculates the volatility value on the basis of max/min range taking into account the current spread dynamics. Indicator signals in author`s interpretation:
- The indicator`s peak means a decrease in volatility and transition of the market in a flat.
- The flat market corresponds to small values of the indicator. An exit from a flat does not always cause a sharp increase in volatility, therefore, the indicator growth happens gradually.
- Volatility growth is perceived as a result of an increase (decrease) of the prices in respect to previous max/min.
- The growth
- The sharp indicator falling speaks about the delay of the movement and close kickback.
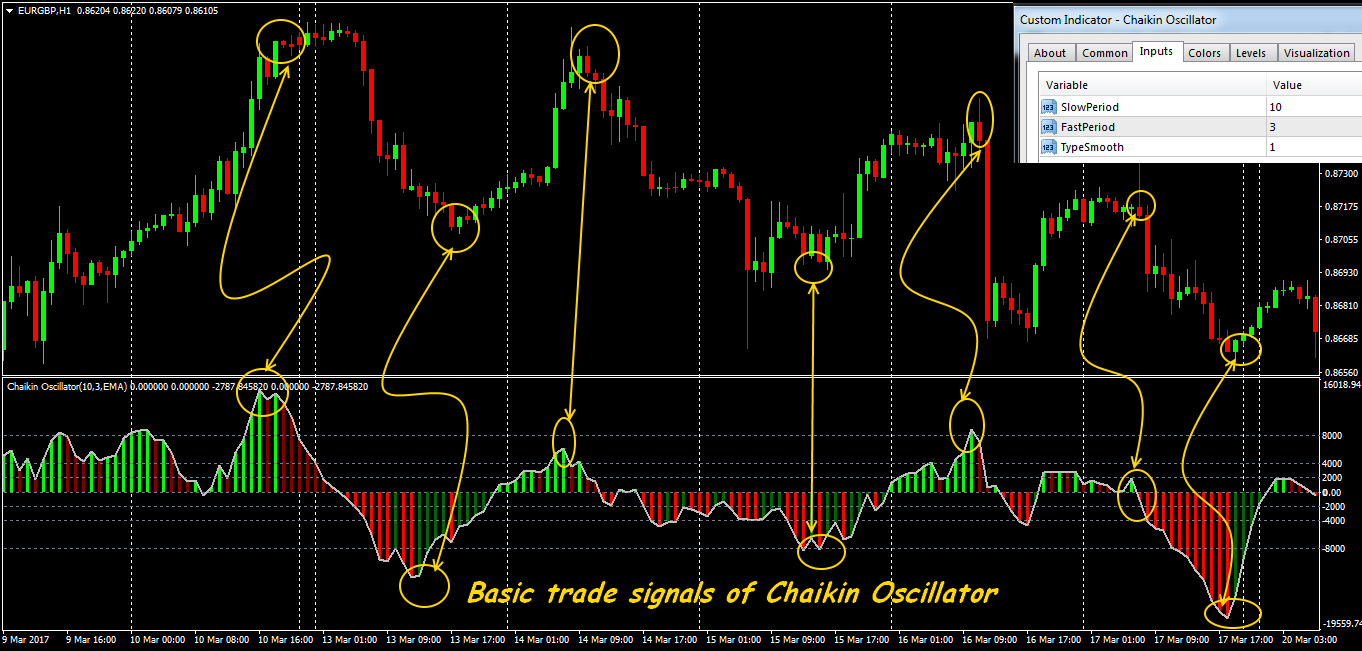
According to the author`s logic, the growth of the indicator on a short period indicates resistance, and decrease on longer period speaks about saturation or proximity of top. As confirming it is possible to use signals from trend indicators, for example, moving averages or Envelopes.
This indicator of volatility was initially programmed for the stock market, for this reason, its formula as much as possible cleans influence of price gaps. As on Forex practically on all trade assets gaps are considered as a rarity, such additional «smoothing» reduces the efficiency of the Chaikin`s indicator − on the most popular periods it concedes to ATR and Standard Deviation.
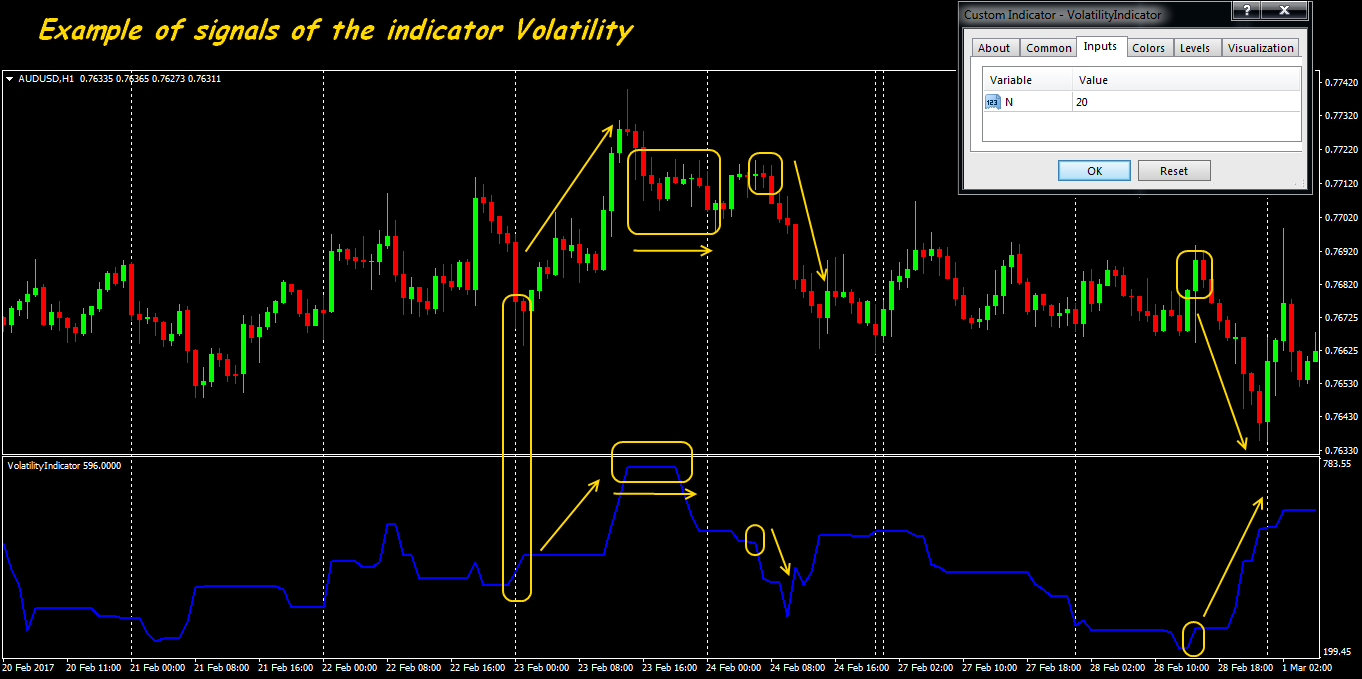
XASER FV indicator
The tool represents that exceptional case when the modern development is more effective than classical options. The indicator analyzes volatility amplitude on the nearest history and at the moment. The interpretation of indications is oriented on trend trade that is considered the orders will be opened only in the direction of the strong tendency. The line moves above the zero line, the indicator eliminates the flat moments, showing on a graphics the beginning and the end of trend movement as points of a potential entrance and exit.
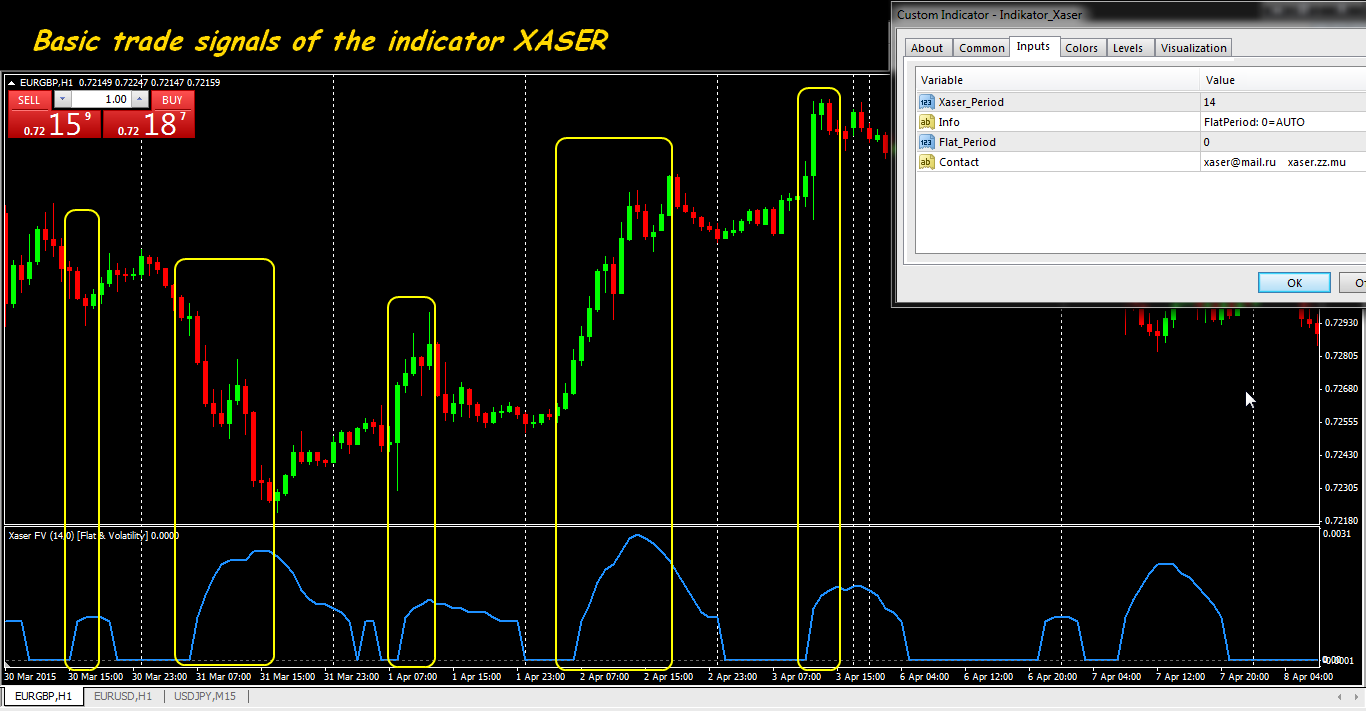
If the indicator value moves about zero – there is flat in the market, and the quicker value grows, the current volatility becomes stronger. Lowering of the indicator after formation of a pick means that the market gradually calms down, trend transactions can be fixed. On the time frames up to H1 the XASER FV indicator is recommended to be combined with standard oscillators.
In any strategy and on any periods the indicator copes with the main task – to filter transactions. If there is volatility in the market, at least, above average, then the indicator will accurately show trend sites.
TRVI indicator
It is an effective modification of RVI volatility indicator, but the standard idea is the farther indicator lines move away from zero level, the trend is considered strong, and the movement near the line is considered an indicator of a flat.
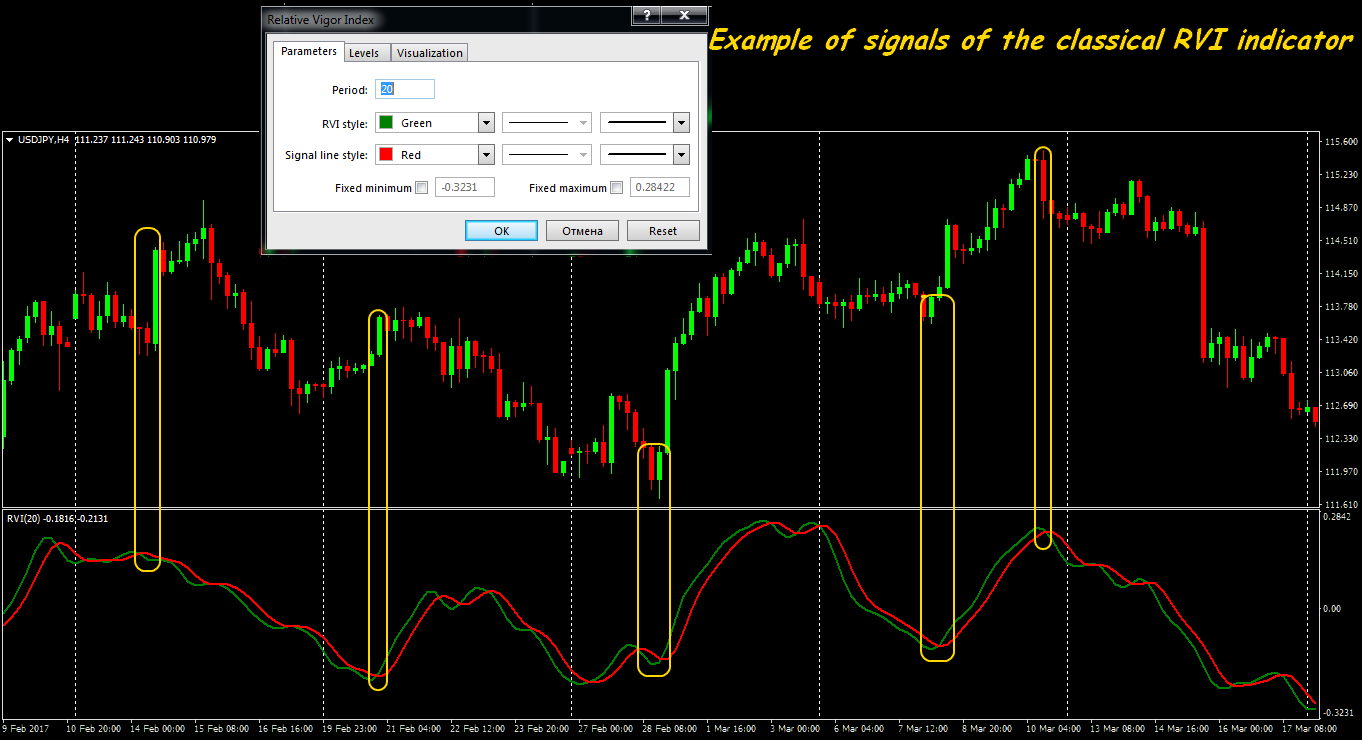
The TRVI indicator operates by the same principle, but dynamics of its values sharper, that can be useful on the periods, bigger than by default. Even the slightest changes will be visible in the form of sharp impulses, and on standard RVI it occurs smoothly and barely noticeable. The parameters are the same – only colors of lines and the period of calculation.
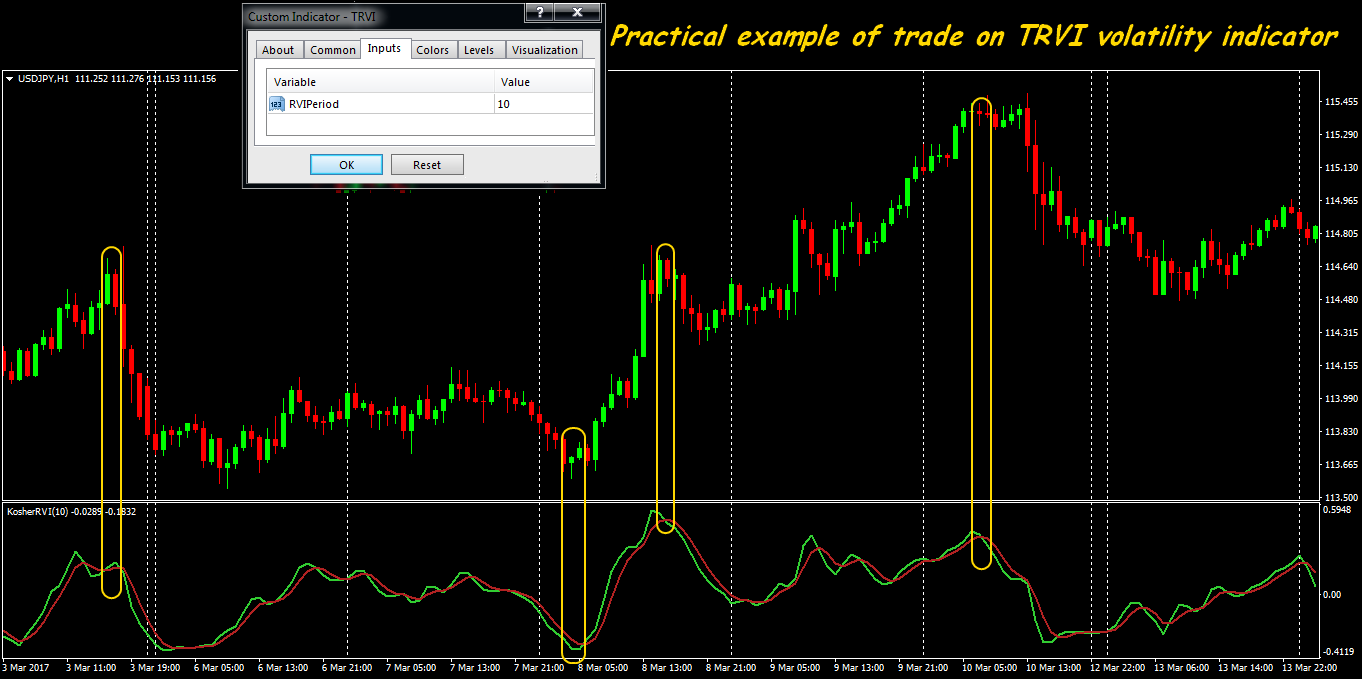
The TRVI indicator always specifies not only the direction of the current trend but also his force at the moment. Its extreme values (too high or low) speak about finishing the trend and transition in a condition of a flat.
Kaufman volatility indicator
For the first time, it has been described by the author in the book «Smarter Trading» together with the adaptive sliding of the same name. The adaptive mathematical ideas of Perry Kaufman allow to filter very effectively market noise and to reveal the origin of a trend in the externally quiet market. It allows to enter in most cases at the start of the movement and to be closed at the slightest hint on flat.
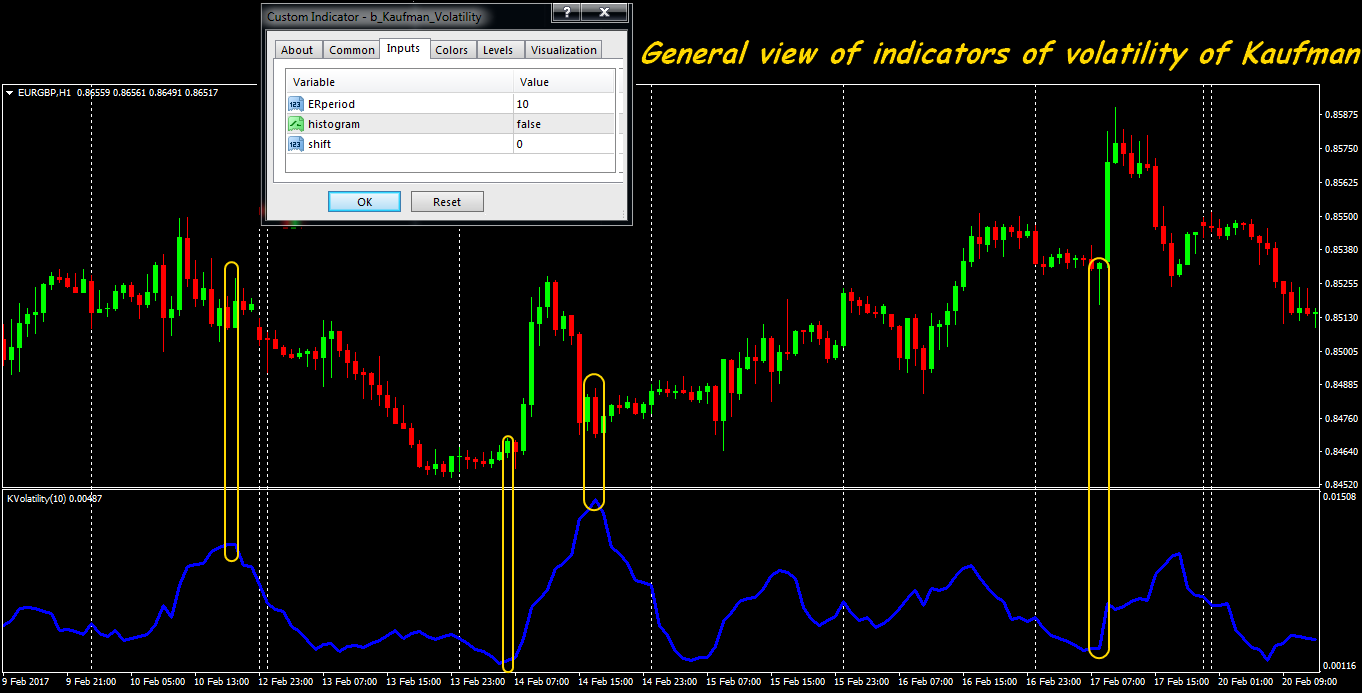
The indicator was originally created for trade in the market by options, but there was very convenient for more volatile spot market, especially for a medium-term position trade.
TDI indicator (TradersDynamicIndex)
It helps to estimate various aspects of the market: trend force, direction and volatility. Sometimes there is no the volatility indicator in a standard set of trade terminal, but its various options are freely available in the network.
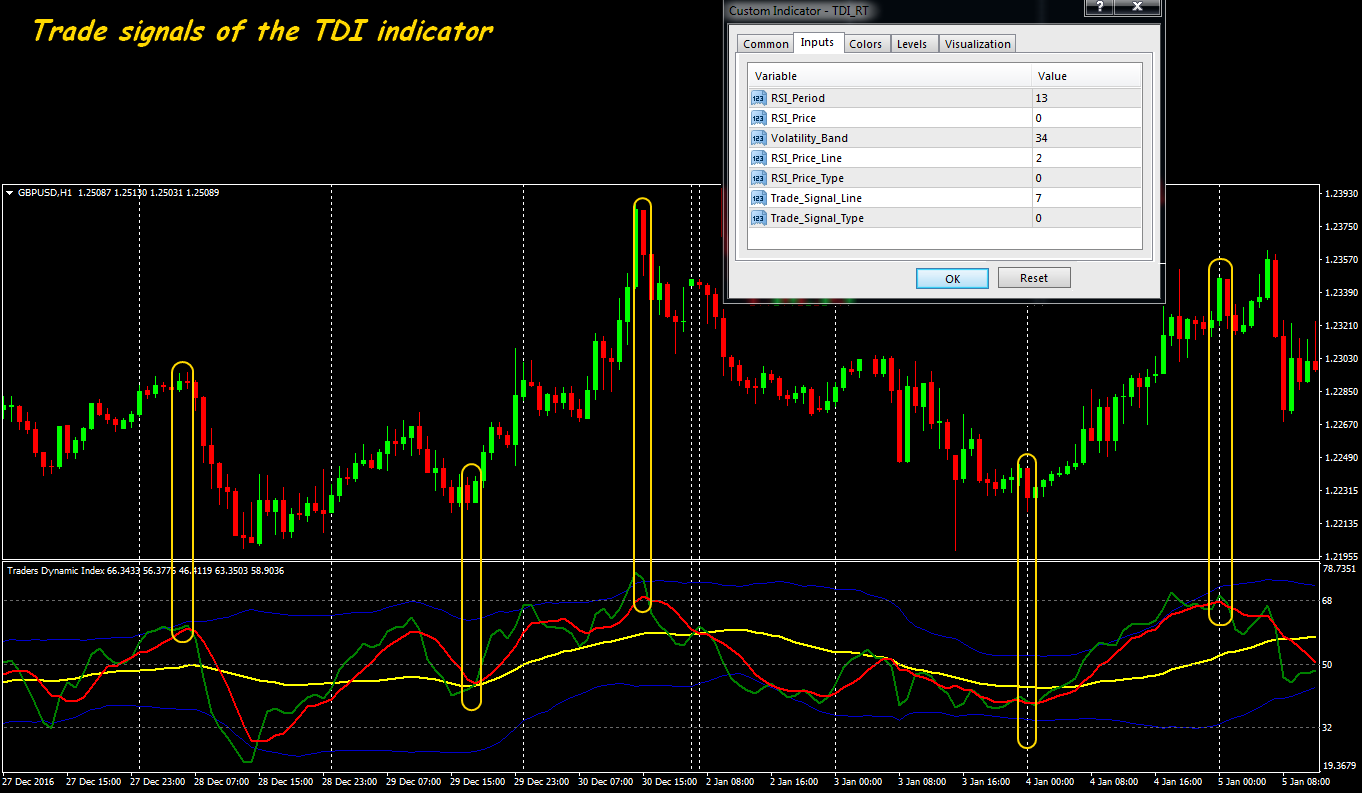
It consists of several basic lines on the basis of standard tools (colors − traditional, in brackets − parameters by default):
- the green line is the RSI line with the RSI_Period (13) parameter;
- the red line − moving average from the above mentioned RSI line with the RSI_Price_Line (2) parameter;
- blue lines – volatility bounds (Bollinger) from the RSI line with the Volatility_Band parameter, 34 is considered as a standard value, but usually, it is reduced;
- the yellow line – the main direction of the market, average on all above mentioned, the Trade_Signal_Line (7) parameter.
The current direction is defined by the position of the green line in reference to the red: if green is above – a trend is bully, below − bear. The main tendency has to be supported by the yellow line: if it goes down and, at the same time, above red, then the descending trend is considered strong. For the growing trend, we argue similarly.
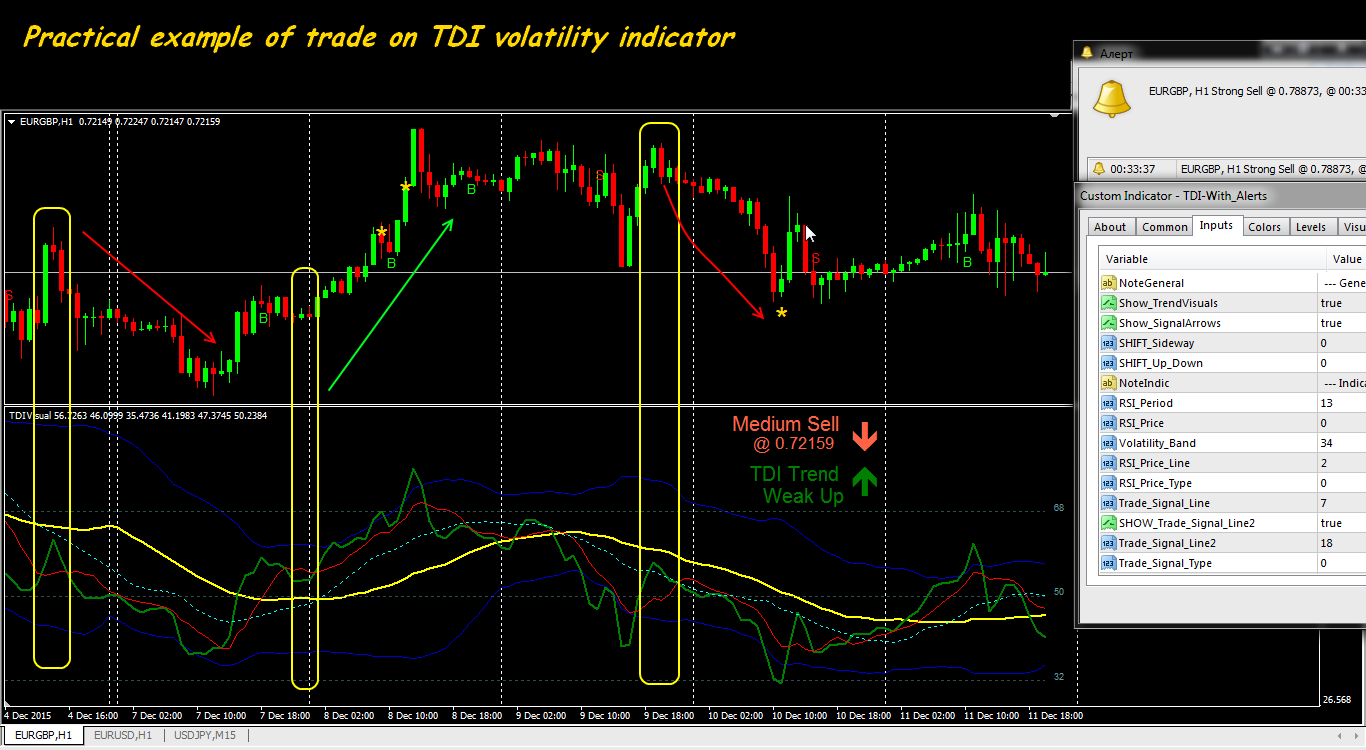
Within the most part of the market time, the yellow line moves between values 32 and 68. They will define both turns, and levels of tops/hollows. If the line moves lower than the level 32, then its breakthrough of level from below up means a turn towards bulls, the line higher than the level 68 means achievement of top and breakthrough of level from top to down will lead to a strengthening of bears.
For the estimation of the force of the market and volatility:
- if blue lines disperse, and green has long inclinations up/down, then there is an activity at the market, at least, above average and perhaps strong trend movement.
- if the blue channel is narrowed and the green line has the short movements up/down – there is flat in the market.
The complex mathematics of the volatility indicator works perfectly at the periods from H1 above, on the small periods can show too active, inadequate dynamics and you shouldn't estimate volatility on it.
FBA NR volatility indicator
The indicator represents one more market activity level control tool and the analysis of its peak values. There two lines are constructed in an indicator window: current (usually − green), and average (red) volatility.
The increase in volatility is defined by mutual growth (sometimes − combination) of red and green lines. The green line reacts by sharp falling to decrease in volatility, and after a while, the average value (the red line) also joins it.
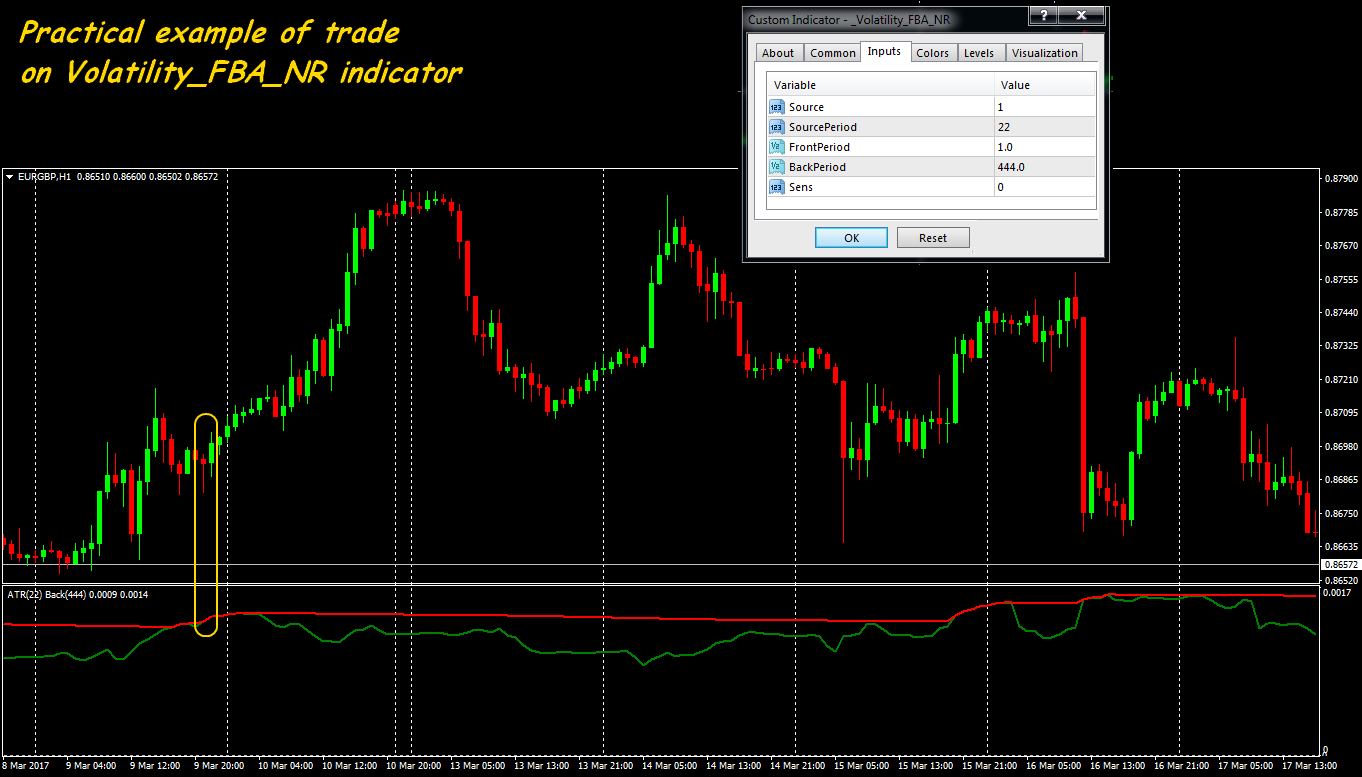
In addition to market price dynamics, the indicator can be used for a tick volume volatility estimation, having just specified volumes as basic data.
Standard input parameters for time frames to H1:
- Source: data for calculation (market volume – 0, ATR indicator values – 1, a standard deviation – 2);
- SourcePeriod: the period for average value;
- FrontPeriod: the period of smoothing of a growth wave and BackPeriod — a decreasing wave;
- Sens: max value of volatility.
The FBA NR volatility indicator is especially useful for estimation of activity on the small periods. It is used only in a set with trend tools.
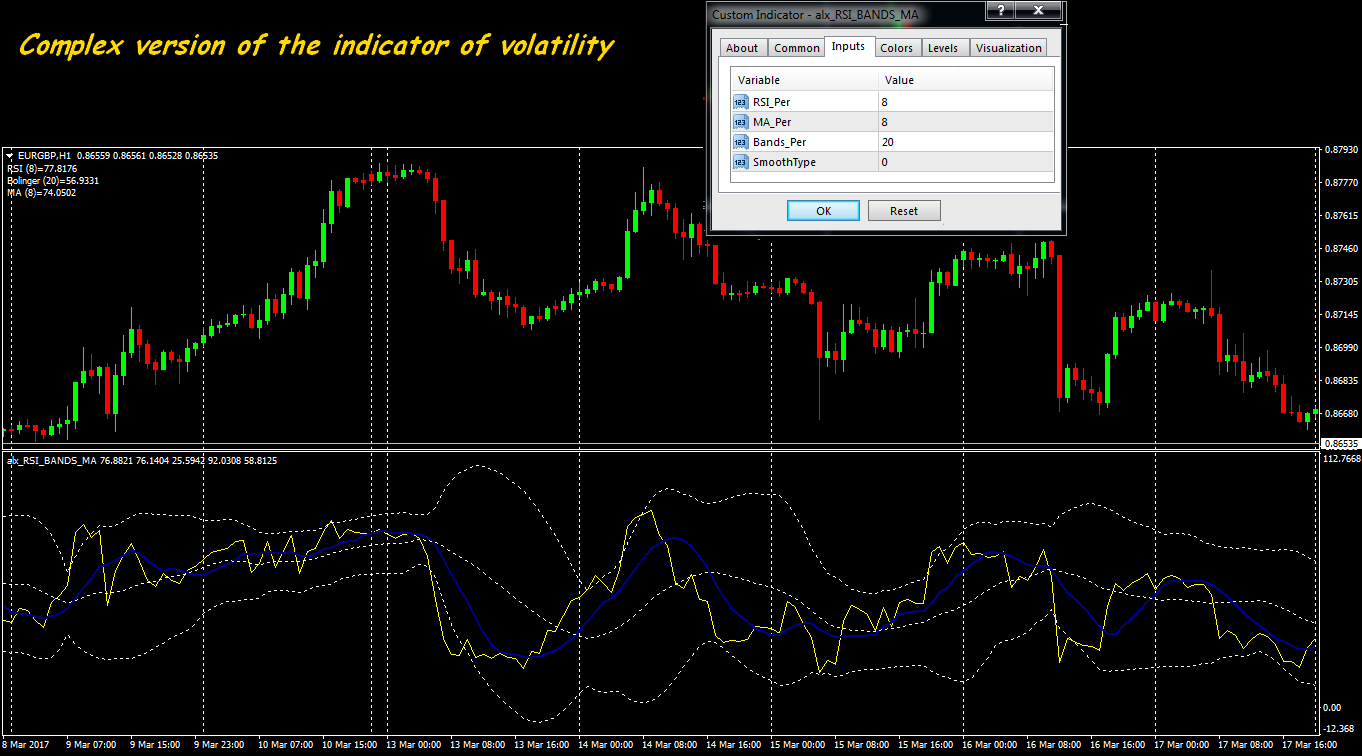
Alx_RSI_Bands_MA indicator
Option for fans of the combined indicators – the standard tools (RSI, Bollinger's bands, moving average) are all in an additional window. Splashes in volatility, of course, are visible, but it is extremely difficult to estimate their advantage. The only advantage that such indicator visually unloads the price field.
And as the conclusion …
One volatility indicator, whatever perfect it was, can't be considered as the only tool of the trader. The market condition during the day can seriously change in connection with actions of large players or emergence of important news when after speculative reaction the price also quickly comes back to an initial state. The interpretation of volatility during the periods of a flat can be an especially problem, and the range from 10 to 100 points, depending on average values for the period, can be considered as flat for different assets. Reacting to each similar splash may cause serious losses, therefore, it is possible to open transactions on signals from volatility indicators only after their confirmation by other means of the analysis.
Values of average volatility (day, week, for reporting month) allows estimating signals of indicators more correctly. Let`s say on statistical data, daily average volatility of GBP/USD pair makes 70 points. As a result, if from the beginning of the day the price has already passed 50 points up, whether it is worth opening a position on purchase? The obvious answer − no, because the probability that the price will pass still some number of points is too small (statistically). And if in this point the volatility indicator gives a trade signal, then you should estimate its reliability taking into account this factor.
Nevertheless, the correct and timely estimation of a price fluctuations range will allow not to be late at the moment with an entrance (when the market already getting off to sleep or is already developed), not to hold the transaction during a long flat, to place StopLoss and TakeProfit correctly. Volatility can quite become a friend, but it always needs to be considered and as serious rival, and, therefore, reliable volatility indicators surely have to be a part of any steadily working trade strategy.
Social button for Joomla