

")
Whatever the skeptics say, technical analysis indicators today are an indispensable tool in the arsenal of many traders. Even such well-known speculators as Elder, Williams and Raschke used these algorithms in their work.
The issue of "what the technical indicators are" should be dealt in detail, as currently many beginners and even experienced traders understand this term as any files that are installed in the terminal folder of the same name.
In general terms, technical analysis indicators are algorithms that describe the historical data with a special formula and display the result on a chart, with the baseline for the calculation always being price or volume. All other "indicators" – for example, informational or those measuring the speed of the price movement – have nothing to do with technical analysis.
What assumptions technical analysis indicators are based on
It is not difficult to guess that these algorithms have emerged after the development of the concept of technical analysis, and therefore indicator analysis is based on the old but generally accepted assumptions. This means that using some formula, the trader takes the following assumptions for granted:
- price takes into account whatever happens in the world; the flow of orders in the market generates a fair price. Thus, each quotation becomes equivalent, and this is very important when using mathematical formulas;
- price movement is not chaotic but is subject to trends, though if we consider the technical analysis indicators, we should talk not only about trends but rather about the laws in general;
- history repeats, i.e. market participants behave the same way at a certain preconditions. The main objective of the indicator is to identify such patterns, after the appearance of which a predictable reaction of the crowd can be expected.
You should also consider another important issue discussed by the proponents of the indicators and adherents of trading on the clear chart – the delay, i.e. situations where the indicator signals appear long after the actual reversal became visible on the chart.
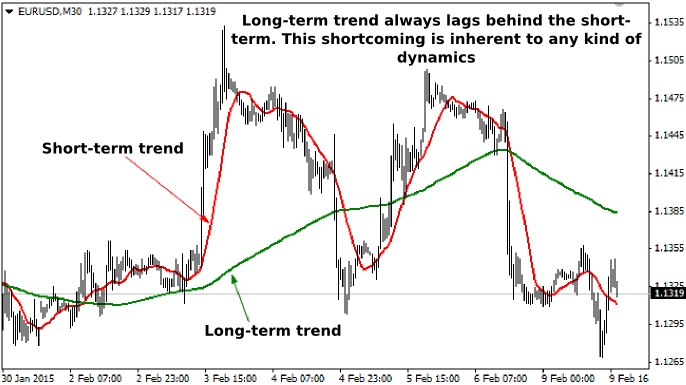
In fact, it is absolutely normal, because, firstly, no indicator can predict the future and is always based on historical values of price and volume, and secondly, it is not the indicator that lags, but rather the long-term trend towards the short-term (recall the second assumption here – markets are subject to trends, and the longer the history, the more it affects the decisions of market participants).
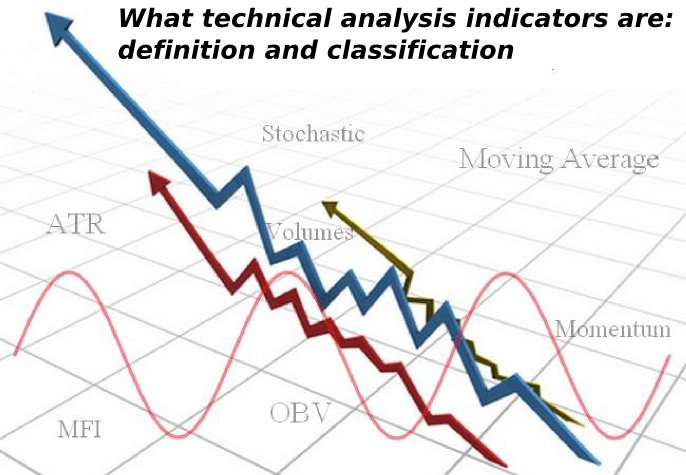
Technical analysis indicators: basic classification
Traditionally, the indicators are divided into three groups: trend, oscillators and volume, but many trading platforms, including MetaTrader that is popular among Forex traders, have a separate group for Bill Williams developments, so let's look at classification in detail.
Trend algorithms are technical analysis indicators for the identification of the current trend. Almost all of them, in one form or another, use moving averages in their calculations, so inherently and by signals they do not differ much from each other: perhaps, only Ichimoku Kinko Hyo can be singled out, which acts as a full-fledged trading strategy.
Oscillators include all formula which values fluctuate near zero (or average) level and repeatedly fluctuate in time. In fact, this term is borrowed from physics and accurately reflects the nature of such indicators.

From a practical standpoint, the oscillators are inextricably linked with the trend indicators, as they complement them with specific entry points and allow to create a trading system with strict rules. Some traders identify oscillators with overbought/oversold states of the market, but it is only a special case of their application – in fact, there are many of such algorithms, and they solve a variety of tasks.
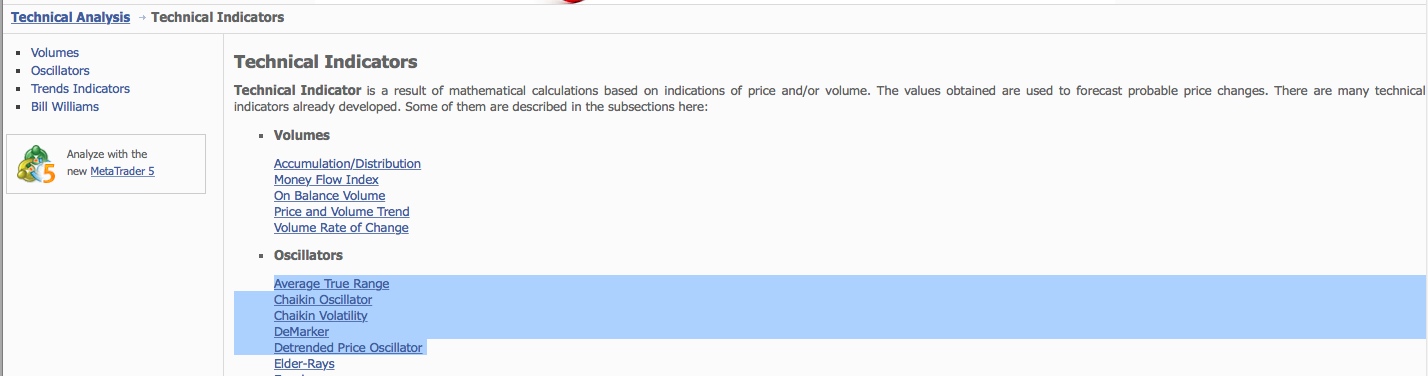
In order to briefly review the classical indicators from these groups, you can visit FAQ on mql4.com ¬– all you need to do is run the MT4 terminal and open "Help → Technical Analysis" in the main menu, and your browser will open a page dedicated to the technical analysis.

But in order to better understand how to use standard technical analysis indicators and their modifications in practice, be sure to check our portal sections "Forex indicators" and "Trading strategies". In addition, valuable information can be found in a special section for beginners – "Forex basics".
The third group is called "volume" and combines the special tools designed for the analysis of teak or real volumes. It includes not only the standard algorithms, but also the development of various users, such as the market profile or standard deviation based not on price but rather on volume.
Volume analysis is considered as a separate method that has nothing to do with technical analysis, but this is misleading, because the third assumption of technical analysis says that both types of studies are designed to solve one problem – find patterns that have proven effective in the past.
Problems of classification and non-standard methods
As already noted, often technical analysis indicators from Bill Williams are singled out to a separate group, but this approach is illogical, because the Alligator is a typical trend type, AC, AO and Gator are oscillators similar to MACD, and MFI is built on the basis of the tick volumes. The only algorithm that cannot be clearly subsumed is Fractal, but since it is used in combination with the Alligator and Elliott waves, it is reasonable to assume that its place is among trend indicators.
Virtually all teachers forget about the next group of experts or mention it in passing, which we believe is a huge mistake. The fact is that today the computer power makes it possible to carry out complex calculations, so traders began to use a variety of regression models in trading often. A simple example of such experts is a non-linear regression channel:
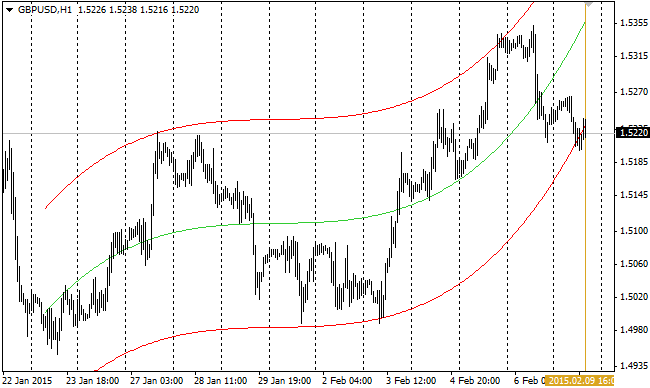
This channel could be attributed to the trend indicator, as it indicates the prevailing direction of the trend, but on the other hand, it can also allow to work from the boundaries of the channel, and you can also build a forecast for the future by extending the range for n periods ahead (a special modification of this indicator was developed for this purpose).
The same applies to the Fourier extrapolator, various correlation models (including intermarket analysis), Hurst exponent and many other methods that previously had to be calculated in special programs (mainly for the daily and weekly charts). Thus, the concept of technical analysis is much broader than is commonly believed, and many books are becoming obsolete.
Social button for Joomla