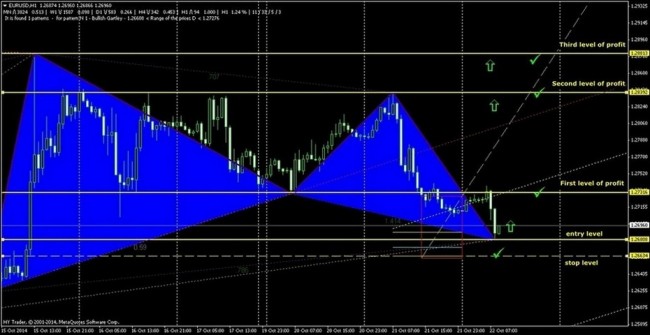
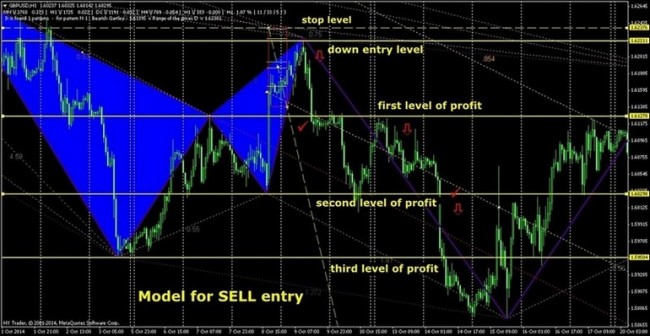
Analysis of the price patterns is included into the set of technical means of any successful trader. The proposed Zup indicator and its various options allow to find reversal harmonic models on the trading chart based on Fibonacci ratios and provide accurate signals to open positions.
In terms of technical analysis, the patterns displayed by this indicator are nothing more than a correction and a price reversal. The concept of “harmonic pricing models” (or GartleyPattern price patterns) was first mentioned in the book “Profit in the Stock Market”, released back in 1935 by an Englishman Harold Gartley. In the 90s of the last century, the mathematics of a purely graphical model dubbed “Gartley Butterfly” was finalized and tied to the Fibonacci sequence. It was found that variants of harmonic patterns perfectly fulfill reversal on all financial instruments and on all periods, but they are most effective on trending markets with a small “market noise”.
The methodology of trading on harmonic models is based on the principle of recurrence of patterns, which ensures high accuracy of forecasts of future price movements. Probability is higher if the actually formed pricing model is closer to the reference proportions. But most often, models appear on the market that are far from ideal, so let’s take a quick look at all the models and their market reaction.
Zup indicator automatically searches for all kinds of harmonic patterns, which greatly simplifies trading.
Mathematics and the principle of the indicator operation
Indicator as a reversal pattern has a very complex calculation algorithm, which is based on the Fibonacci levels. For the appearance of the graphic, stringent mathematical relationships must be met between the price parameters.
In the harmonic series of the indicator, the following values are commonly used:
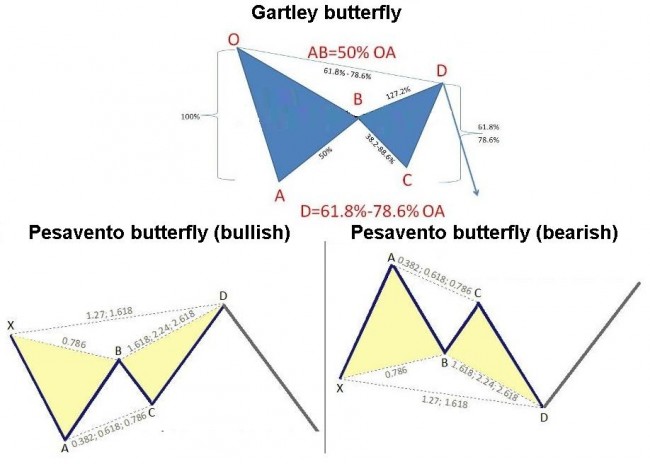
0.382/0.618/0.5/0.786/0.886/1.27/1.618/2.00/2.618, of which two are non-standard: 0.786 and 1.27 (the square root of 0.618 and 1.618). Another special value of 0.886 (fourth root of 0.618) was introduced by J. Kane specifically for Forex market.
Important: If a Butterfly pattern visually “flies up”, you should expect a reversal down from the top edge of the nearest “wing”. When the “wings” of the pattern look down, you have to hike up from the lowest point.
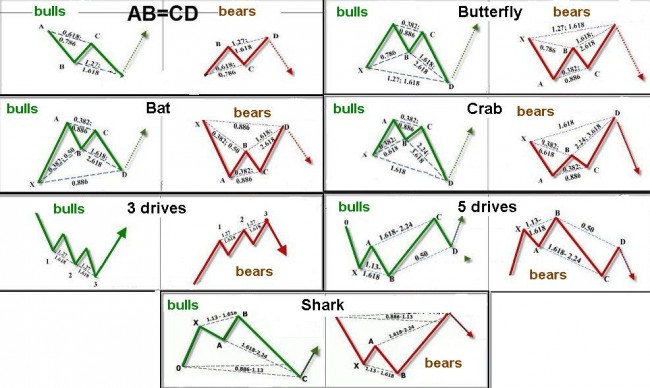
Here are the most popular graphical models that the Zup indicator analyzes.
Model AB=CD (equivalent pattern): this model is basic that is included in all the models considered. There are two mathematical options:
- first is 61.8/161.8: height of B to the horizontal line through C is 61.8% of the height from B to the line through A; the height from D to the horizontal line through C shall be 161.8% of the height from B to the horizontal C;
- second is 78.6/127.2: it has a similar calculation but with different data.
Sometimes each “ray” of such a model on bigger periods consists of smaller independent patterns that can also be fulfilled as standalone models.
Gartley butterfly (Pasavento butterfly or "ideal Butterfly" as an option): this model, like a nest-doll, has AB=CD pattern as part of its design with various additional parameters. Figures on the same timeframe are part of the same or different patterns on bigger timeframes.
Bat: versions of a butterfly – it is based on the ratio of 0,886 the distance to D, i.e. it has other “wing” proportions.
Crab: a very rare model, it differs from the ideal butterfly by small amplitude of the AB segment (not more than 61.8% XA, the optimal values are 38.2%-50%). “Deepwater” crabs are called models with the completion at the level of 161.8% and B above 50%. Its edges are used to set the take-profit, but the model is very dangerous to open a position.
Triple drive: analogues of the model of “Three Indians” from the wave analysis (see books of famous Linda Raschke). According to the classic, 2nd and 3rd waves end at 1.27 or 1.618 levels, and the corrections do not exceed 0.618/0.786. In real life, it is rare, but has a high probability of an accurate prediction – it means a signal of trend weakness and expectation of correction. There is a version of the pattern – 5 drives, having the highest forecast accuracy.
The newest model is Shark: 5-0 version of the model, when D is located at the confluence of AB=CD and at a distance of 50% on Fibo from the BC foot segment.
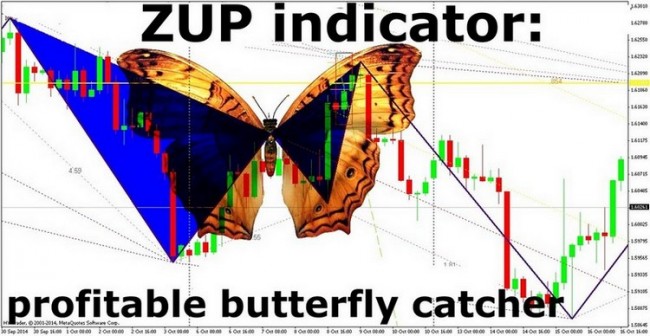
Visually, the indicator builds the set of lines, each of which carries a serious analytical load, determining the characteristics of the existing trend and its readiness for a reversal.
When using the indicator, the trend fractures directly overlap the price chart, the pattern is defined by zigzag built-in mechanism, the resulting model is filled with color (usually blue). Yellow, red and purple lines define the so-called Pesavento patterns and determine the basic calculation lines. In the built rectangle, yellow and blue lines help to identify the entry point and the recommended stop-loss level for Gartley patterns.
Entry point is the corner of the nearest (the last) triangle and the levels of support/resistance correspond to the lavender dotted lines.
Setting
The Zup indicator is set by the standard way for MetaTrader4(5). It has a lot of options, most of which can be used with the suggested values, and we configure only the most important ones:
- MinBars: minimum number of bars to calculate (or bar filter), 12 by default;
- MaxBar: measured in % for the calculation of BigLevel, 1,000 by default;
- ExtDeviation: ZigZag basic parameter, 8 by default;
- MaxDepth: max value of Depth, to the level of which the main Depth parameter of zigzag varies during scanning (patterns search) of Gartley, 33 by default;
- ExtFiboCorrectionExpansion: takes two values: true – use of Fibonacci extension, false – use of correction of Fibonacci, recommended to set to true;
- ExtFiboFanExp: FiboVeera number of rays, recommended to set to true;
- ExtGartleyOnOff: moved of view of Gartley patterns, usually true.
Use of Zup indicator in trading
The main thing for a trader is to find the optimum point to open a position. In working with this indicator, timeframe from M30 up to D1 is recommended with the search for a specific entry point on the M15 period. The indicator gives the following advice to enter the market:
Signal to buy
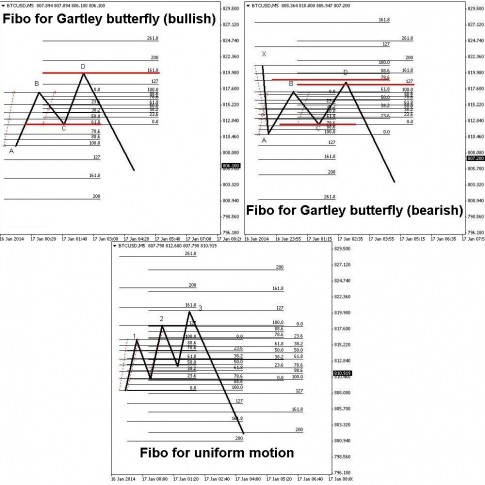
In any bullish pattern, the first opportunity to open: D on the market or a Buy Limit pending order. The second option (conservative, but more reliable) appears after the formation of a clear D – Buy Stop can be set (to the possible breakthrough of the trend line), or enter the market after a closed candle above the trend.
The stop is set under the indicator with the Fibo level of 78.6%. Take-profit: the goal No.1 is A, then (perhaps with trailing) we move across the Fibo levels.
Signals to sell
D is the first to enter on all bearish patterns, on the market or through a SellLimit pending order. More conservative entry is to put BuyStop after the formed D to the breakthrough of the CD trend line, or enter by the market for sell after the closed candle behind the trend lines (below).
The stop is just below (a few points) above the Fibo level of 78.6%. Take-profit: A on the pattern – the first profit-taking, and then – across the Fibonacci levels.
Advantages and disadvantages of the indicator
You should not forget that the moments of a trend reversal are always accompanied by sharp speculative price surges, especially if it is in close proximity to important price levels of support/accompanying. That is why the value of the indicator is reduced on small periods – there is no noise filtering, so you can only use it at periods of less than 1H in the set with the oscillators.
The first drawback of the indicator is that reference models are rare. The second drawback is that graphical representations often redraw.
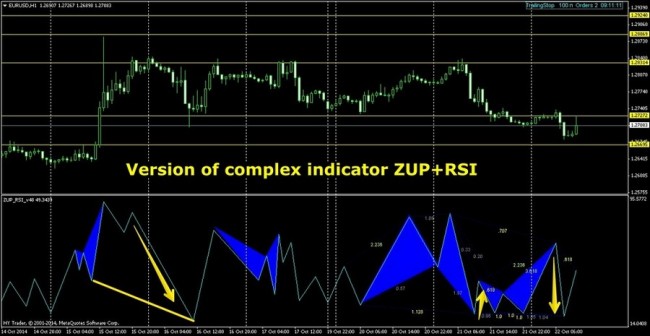
You must wait for the well-formed pattern and the fractal indicator can be used to confirm the entry point. The Zup indicator in trading strategies (sometimes named as Butterfly) works well together with RSI, CCI, Momentum, MACD, and there are complex indicators Zup+RSI or Zup+MACD.
If harmonic models appear when using the indicator on the chart, it is necessary to analyze the same constructions on the smaller/bigger periods and only when the model appears on several timeframes at a time and the signal is confirmed by additional indicators, you can confidently open the position.
Harmonic patterns have a high degree of fulfilling and are really trustworthy. Accuracy of Gartley models using the Zup is extremely high: close to 85% of transactions are closed with profit.
Social button for Joomla


