Many important occasions and news have occurred recently, many important statements have been made. The European currency fluctuates, confusing traders who intend to know future prospects. If it is difficult to determine the impact of the fundamental factors on the EUR / USD pair, one should use the method of technical analysis and look at indicators that will show the general trend of the currency pair and, most probably, will determine plan of further action.
If you remember, the indicators showed the uptrend last time. However, we noted a strong deviation from the indicators, and we mentioned the possibility for their convergence, in other words, the corrective movement. Today, we will carry the indicators review with the aid of basic traders’ tools - Moving Average (200), MACD and RSI.
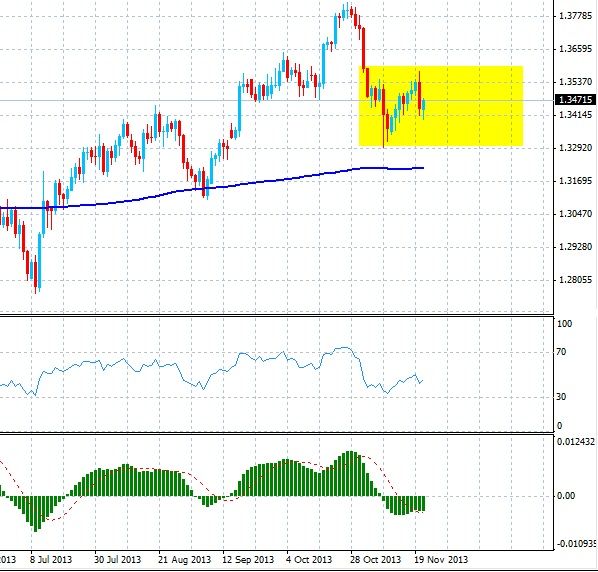
The pair EUR/USD declined considerably after a week's growth, with losing all positions which it gained due to this growth. Let's start with the first indicator - the moving average for 200 days. It should be reminded that we analyze the daily chart to make our analysis more reliable and effective. So, MA (200) as you can notice is moving almost horizontally, with no tilt. This fact shows us that the trend is slowing down and the pair EUR/USD, in fact, stands at the same level and it is in a sideways trend. The price is still above the moving average, which means that it is located in the so called “buy” zone, so the «buy» transactions are more likely to produce a profit rather than “sale” transactions.

The indicator RSI is the next in line. Having analyzed the indicator chart one can mention that recently it was close enough to be oversold, whereupon it began to raise. By today, the indicators’ trend has not been clear and the indicator is located more in the neutral zone. These indicators featuresdetermineaslowdowntrend.
The MACD indicator fell below the line of discharge. Under a technical theory this fall is a sign for selling. If one bears in mind that the EUR/USD pair had an upward trend, he or she can consider the MACD signal as its ending.
As a result, we have multi-directional indicators. It can mean only one thing for a trader that the market is uncertain. And its uncertainty is usually shown in a lateral movement with defined boundaries. We believe that the diapason from 1.3600 to 1.3300 may form such boundaries. Moving average can be considered as additional support as well, it is approximately at 1.3200.
Social button for Joomla


