

")
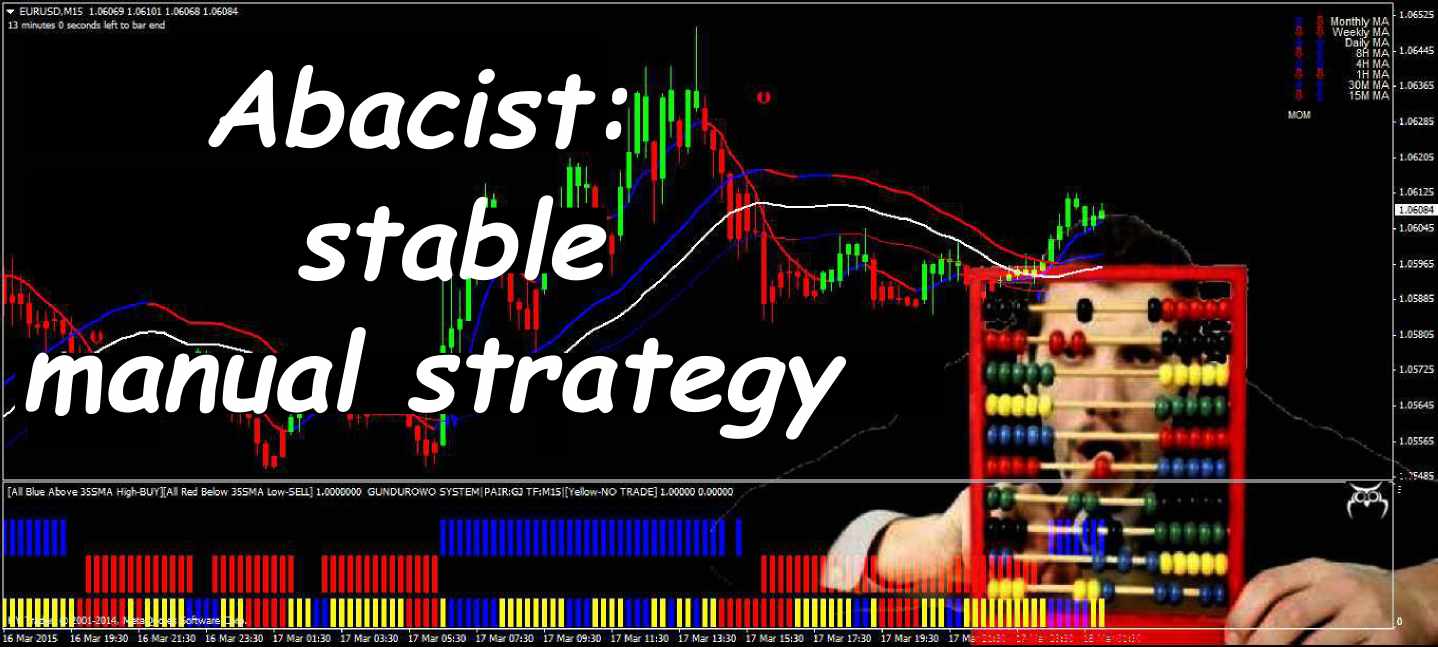
Despite the abundance of means of trading automation, there are traders who work with positions manually. The suggested manual strategy may seem too colorful and overloaded with indicators, but in fact it contains nothing superfluous and provides stable income on a trend market.
It’s another variation of the set of moving averages with a modified oscillator in the form of a color histogram. In an attempt to take into account all possible factors, it reminds of the approach to accounting statements. Working screen looks like this:
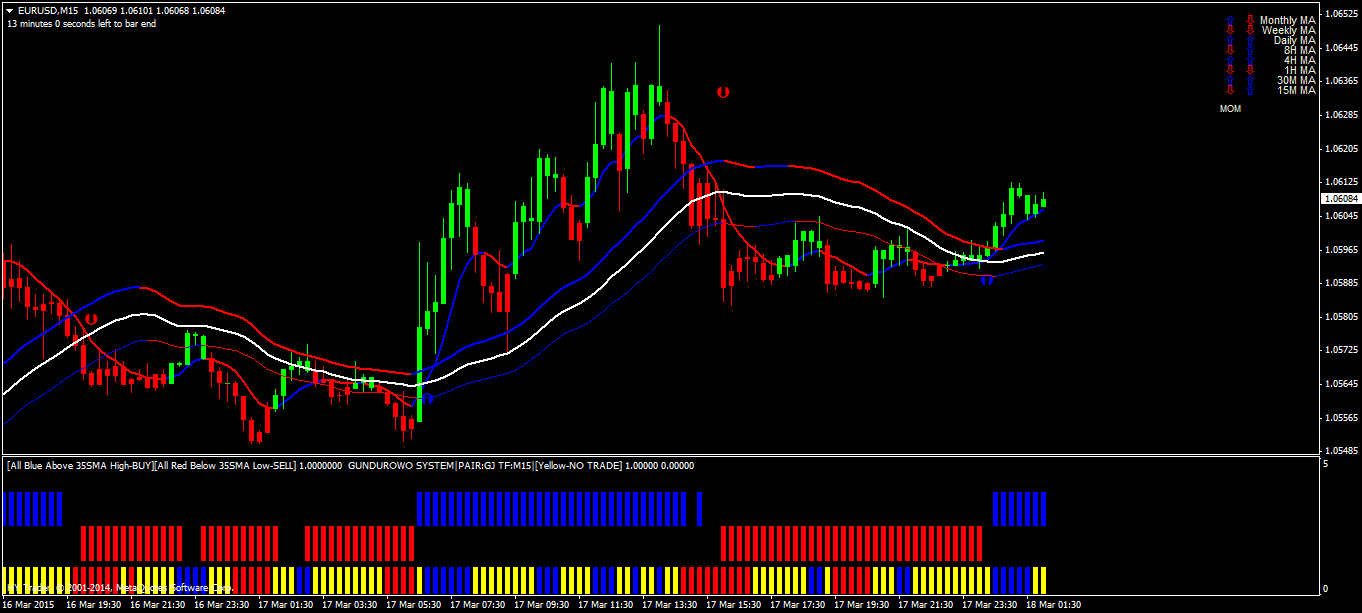
The manual strategy demonstrates all types of trending techniques on the chart – tracking the trend (in the form of highlighting), RSI-filters, intersections of the averages and the breakthrough of the price channel, the momentum of the main direction on longer periods. There are no special requirements – just good theoretical training.
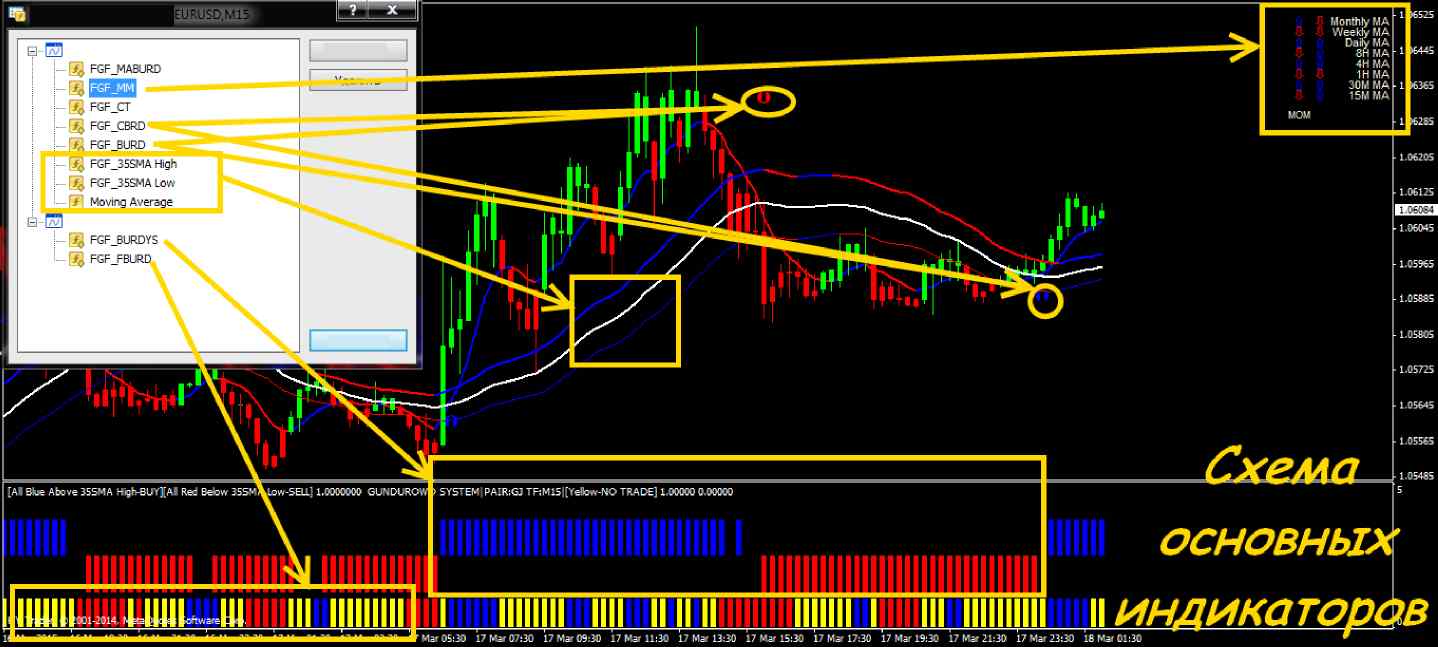
Installing and configuring indicators of the strategy
The setting is done in a standard way: the strategy template is copied to …\MetaTrader\templates, indicators – to …\MetaTrader\MQL4\Indicators. Nothing was changed in indicators during testing, except for the color scheme. Template strategy consists of 10(!) indicators, two of which are informers, while others are involved in making decisions.
Let’s briefly review the purpose of each.
Indicators on the main price chart:
- MA Candles indicator of the manual strategy paints the candles in a bullish (in this case – green) and bearish (red) color. Algorithm of the "paint" is based on the analysis of two averages with periods of 2 and 8: if SMA(12) crossed SMA(8) upward, all subsequent candles will be painted in bullish color until the reverse intersection (downward) – in this case, the candles’ color changes to red. The parameters can be optimized for a specific instrument on your own.
- Standard trend indicator Moving Average on closing prices with the base period of 35. The parameter can be changed, but only in conjunction with all other averages involved in the strategy. The following two moving averages form a dynamic price channel.
- FGF 35SMA High indicator is based on the moving average with a period of 35 built on highest prices of the closed candles. It can be seen on the chart as a red and blue line: the blue part is uptrend, the red part is downtrend. It is easy to optimize by customizing settings of the moving average.
- Manual strategy contains a copy of the previous indicator – the FGF 35SMA Low indicator, but calculated on the lowest prices.
- FGF MABURD indicator is a faster moving: red and blue modification of the ordinary moving average with period of 10.
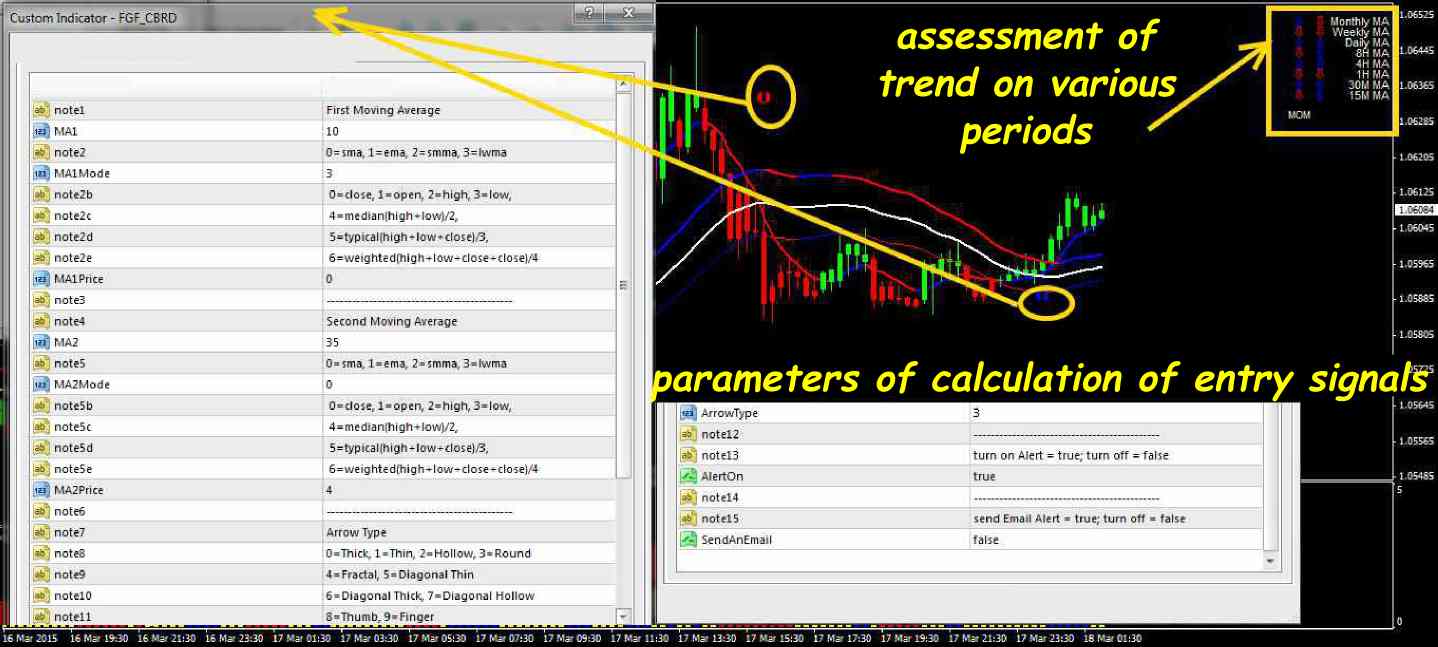
- FGF CBRD indicator paints the arrows above the entry points – it actually tracks the intersections of the moving averages with periods of 10 and 35.
Indicators of the manual strategy in an additional window:
- FGF FBURD indicator ¬– a red and blue histogram in the first window is based on the RSI(7) indicator. In this strategy, it acts as a filter.
- FGF BURDYS indicator is also a color histogram, but based on moving averages. It tracks the direction of the trend as an additional filter: blue color means a bullish trend, red color – a bearish trend, yellow –flat.
Informers:
- In the upper right corner, the FGF_MN indicator monitors the two types of momentum on various periods by colored arrows.
- FGF_CT shows time until the close of the candle under the name of the instrument in the upper left corner of the main screen.
Important: practical purpose of these indicators in the strategy is rather weak, so they may well be excluded from the template.
Use in trading
Currency pairs EUR/USD, GBP/USD, AUD/USD, USD/CAD are traded quite fine; you can also try indices in non-speculative time.
Important: since the strategy is based on moving averages, it can only be used effectively on a trend market and medium-volatile instruments.
Manual strategy works fine during the European/US session. Timeframe to search for entry points is M5-M15. The best deals are medium-term, with a lifetime from H1 to D1. Do not trade before/after the news, as well as during the flat.
Order to buy is opened under the following conditions:
- Candle of the bullish (blue or green) color of the MA Candles indicator closes above the line of the FGF 35SMA High indicator, which means that the price crosses the line upward and closes with a bullish bar.
- At the same time, the FGF CBRD indicator should show the "Up" arrow.
- A blue bar of the FGF FBURD indicator is in the additional window in the bottom part.
- Histogram bar of the FGF BURDYS indicator must also be painted in blue (if the color is yellow – do not enter, because the market is flat).
- A buy signal is considered strong if at the moment of the price crossing the line of the FGF 35SMA High indicator, the indicator itself was also of a bullish (blue) color.
Sound alerts appear at a possible entry point.
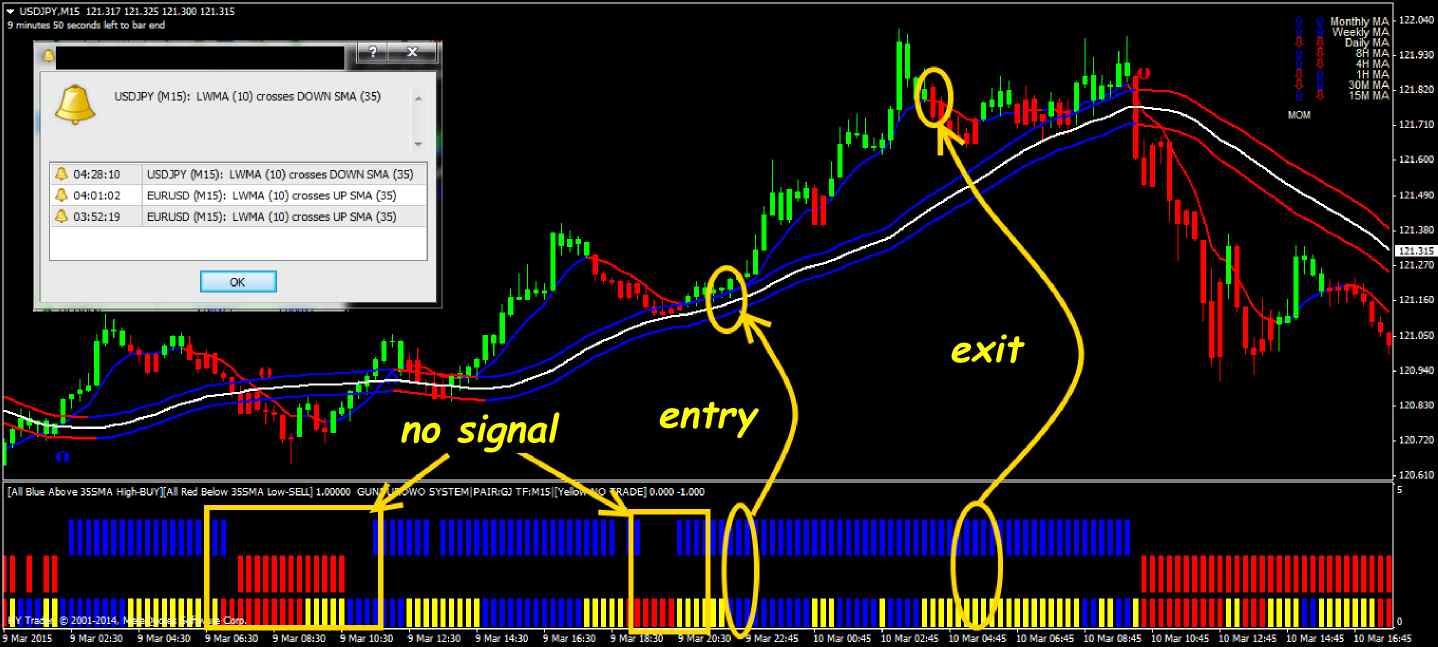
Important: please assess the situation in complex, because the appearance of the arrows usually delays and you can miss a good signal.

Order to sell requires the following conditions:
- The red candle of the MA Candles indicator should close below the FGF 35SMA Low indicator, i.e. the price crosses the line downward and closes with a bearish bar.
- At the same time, the FGF CBRD indicator should paint the "Down" arrow.
- A red bar of the FGF FBURD indicator should be in the additional window in the bottom part.
- Histogram bar of the FGF BURDYS indicator must also be painted in red (if the color is yellow – do not enter).
- A sell signal is considered strong if at the moment of the price crossing the line of the FGF 35SMA High indicator, the line itself was also of a red color.
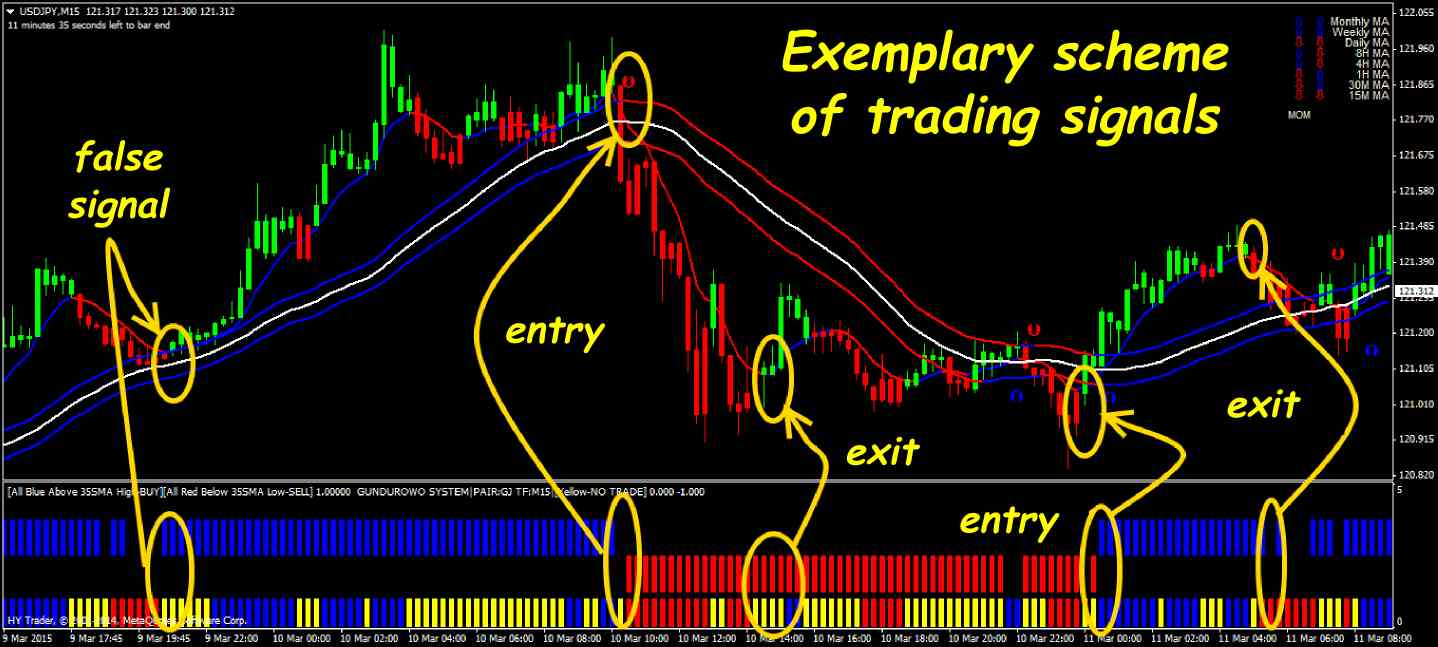
Important: manual strategy gives two types of signals: weaker or stronger, more reliable. You can use both, but the signal strength may help better calculate money management.
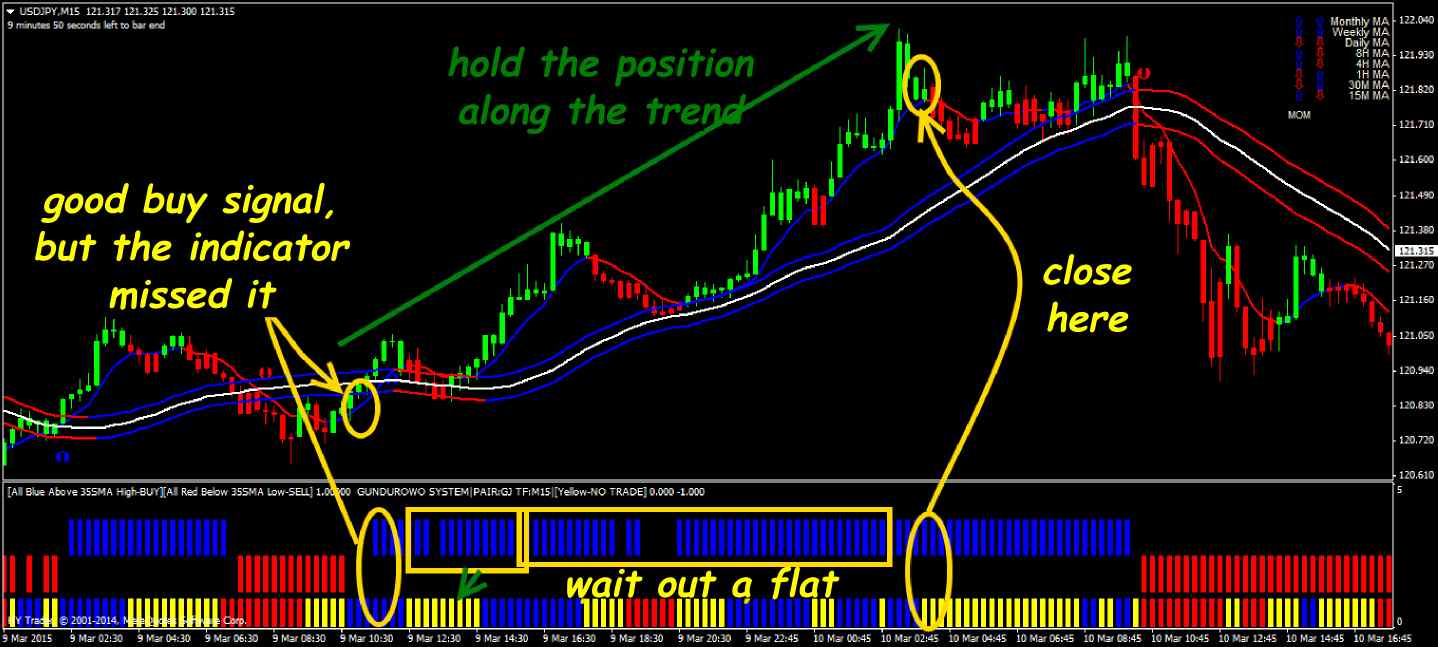
Closing of positions and stops
The most patient traders can do it traditionally – hold an open position along the trend until a clear opposite signal appears, while trailing a stop.
Careful traders can be recommended to move the stop along the line of the fastest moving average – FGF MABURD, at a distance of 10-15 points (or more), depending on the average daily volatility of the selected instrument. A stop can also be placed at local extremes.
And as a conclusion...
Despite the abundance of indicators in the template, the default settings of the set obviously require optimization. As with all the strategies built on the moving average, the method works badly during the flat and regularly delays even during the trend.
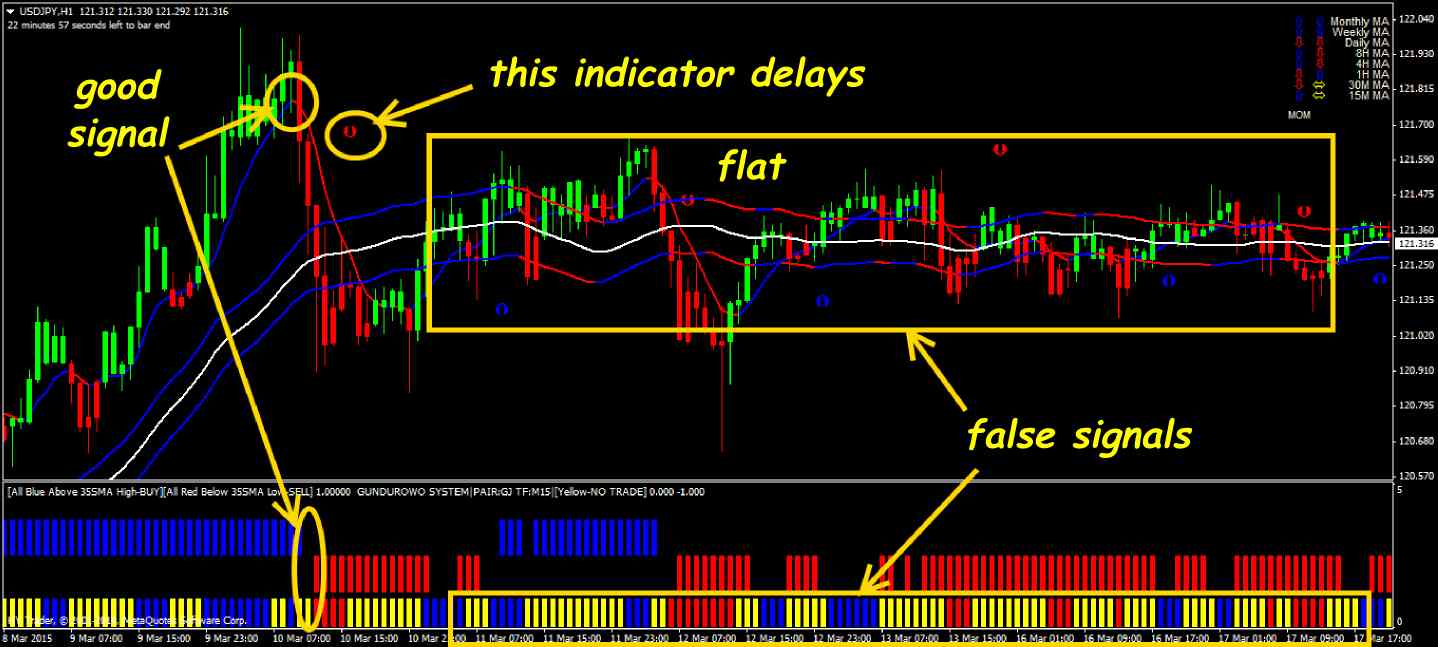
Or it misses clear signals, although it follows the trend quite stably:
This manual strategy is multicurrency (trend is trend, no matter where), but it gives many false signals on too active instruments – this is due to the math of averaging. At reasonable approach to capital management, it can even be used for scalping on M15-M30. Overall, this strategy can be offered to cautious beginners who learn the basics of trend trading. Source: Dewinforex
Social button for Joomla