

")
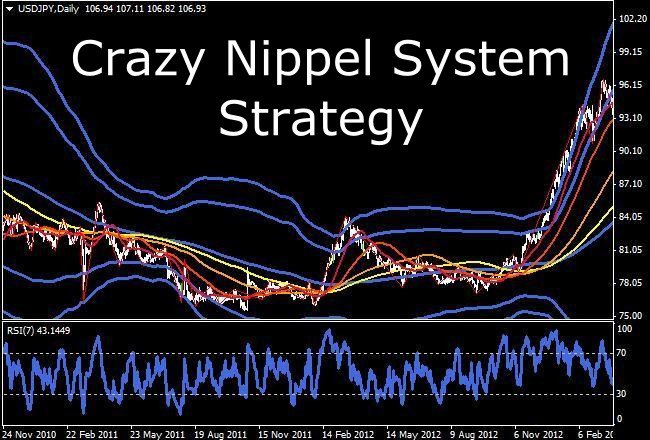
Crazy Nippel System Strategy was created in 2013 and has managed to gain popularity among traders due to the successful combination of many known techniques of technical analysis in the algorithm – from Elder screens and indicators to price levels.
Before proceeding to the description of the method, we should note that the beginners who recently learned about Forex trading are better to just add the page to bookmarks and not to try to apply this knowledge directly in practice, due to the fact that some of the techniques require experience.
As is clear from the title, this system is scalping, therefore, in spite of its universality, it is better to choose volatile pairs with low spreads for work – as a rule, they are “majors”, but sometimes you can also meet exotic options, like Mexican peso. In fact, it all depends on the conditions of the dealing center, so no restrictions apply.
Versatility of the system is explained by strong signal filters – in particular, as already mentioned in the beginning, the search algorithm of entry points is built by analogy with Elder screens and uses multiple timeframes, starting with the daily charts and ending with minute.
Basic rules of trading under the Crazy Nippel System strategy
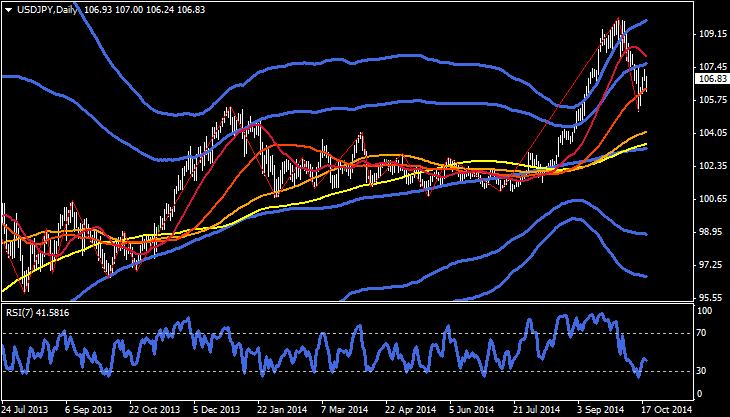
To simplify the learning process, we’ll just move on to a description of the stages of analysis, where we will describe the parameters of the indicators, especially given that only standard algorithms built into any terminal by default are enough for correct operation. So, the first stage is creation of a template for the daily charts, for which we will need to configure the following indicators:
- Four simple Moving Averages, built on the closing prices with periods of 150, 100, 50 and 21. Of course, they must all be of different colors;
- Two Bollinger Bands with the same period of 200, but with deviations of 2 and 3.
- RSI for seven bars with standard overbought and oversold levels (70 and 30). The figure below shows an example of the working window on the USD/JPY pair:
Visually, the system is a bit shocking, since the basic "good manners" in indicator trading is minimalism, but in fact is not so terrible, because all of the listed tools only support the strength of the levels marked manually and of candlestick patterns that you will also have to look for on your own. If we go back to our previous example, we can see the presence of a signal to buy, because the price has touched a strong area of support and 50-day moving average:
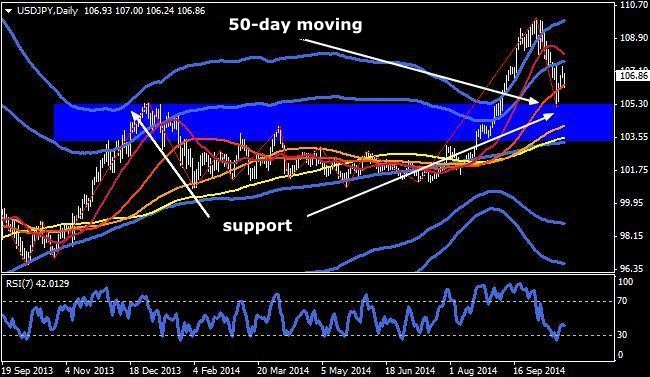
Of course, the more evidence the better, an especially strong signal is touching the 200-day moving average, but the things are not so clear with the Bollinger Bands. Based on experiments and based on the specifics of the tool, it is better if the price is between the central Bollinger line and the first boundary (which recedes per deviation), since this combination indicates the continuation of the last pulse.
In addition, it is important for RSI to be in the oversold area, and divergence may act as a further signal. An experienced reader may note that the Crazy Nippel System strategy makes too many assumptions (if, if, etc.), but this is not its fault, but rather an advantage, because it makes it possible to break up the lot, depending on the signal quality and number of confirmations.
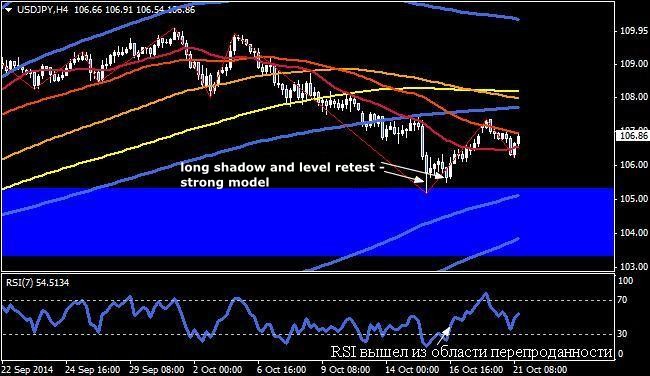
Then we expand the H4, without changing the parameters of the indicators. On this period, we study the behavior of prices around the level of support, mainly using Price Action methods, as well as looking for the moment when the RSI goes out of oversold area. We recall that on the daily chart it is important to touch the level of 30, and on H4 – it is the intersection of the level upwards.
Making deals under the Crazy Nippel System
The fun (trading) begins after analyzing the higher timeframes. Of course, you can stay with the above rules, and the result will be good, but the authors recommend that you perform a few actions, and we will take a closer look at them.
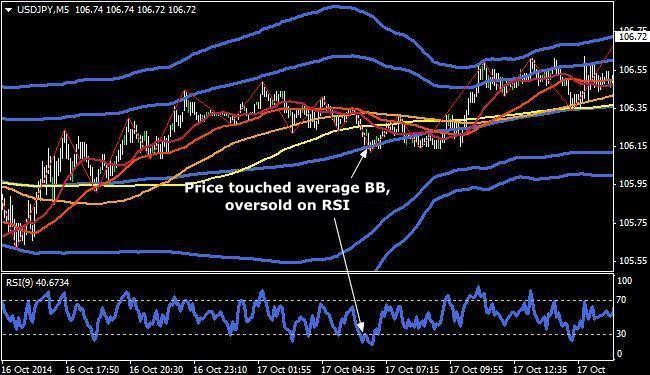
First of all, we open the 15-minute chart, change the RSI period from 7 to 9, while it is acceptable to use ZigZag as a secondary filter, which was on the chart all this time and was likely to cause issues. At this stage, we investigate the short-term trend using the extremes, and the search of an appropriate rollback is conducted for the possible opening of the orders.

Secondly, we assess the situation on the 5m. In this case (see the figure below), the RSI is also in the oversold area, and the price touched the center Bollinger line, indicating either the formation of a new momentum in the near future, since the standard deviation got back to normal, or a willingness of the bears to "push" the market yet below. For a better understanding of the algorithm works on Bollinger Bands, we recommend to check the respective publication.
And the last step on the way to the opening of the order: study of the minute charts and assessment of the potential movement. In this case, Bollinger Bands can also act as the confirming signal, but this time the touch of the opposite boundary should be taken into account. In fact, the author of the Crazy Nippel System recommends to rely on the reading of RSI, but, in our opinion, the use of this indicator designed for only 9 minutes is a rash step.
Potential movement is estimated by the trader by the levels, or the profit is taken at the formation of a strong candle pattern on the 5m. By the way, that's why the considered system is recommended for experienced traders who already know a lot, but can’t formalize their knowledge in one algorithm yet.
Support of transactions and other nuances of Crazy Nippel System
As can be noted above, the deals are opened without stops, but not because it is expected to sit out the loss, but because of the use of grid orders. Thus, if the price continued to move against the open position, the Martingale enters into force, the mere mention of which makes many "cringe".
But we should not jump to conclusions, as the Crazy Nippel System strategy is one of the few algorithms, where a similar approach works due to reliable signals, all you need is only to calculate the true range of variation for each pair, and based on the value obtained, determine the spacing of the grid. The author proposes the following sequence of actions:
- Define the boundaries of volatility (call them LimVol) for 120 days by the search of the most volatile day. You can use the ATR indicator to calculate the period of 1 day;
- The value obtained in points is the maximum risk on the grid (stop);
- 0.8*LimVol is the width of the entire grid;
- Determine the spacing between the orders according to the formula (0.8*LimVol)/n, where n is the number of orders (determined based on the amount of the deposit and the experience of the trader).
In conclusion, we should note that there is another version of this strategy, the logic of which is no different from the base case, but some non-standard indicators make it workable only on MT4. Taking this into consideration, it was decided not to focus attention on it, because today more and more people are moving to other terminals. Source: Dewinforex
Social button for Joomla