
Ruler strategy is focused on the daily charts and has one goal – to take maximum profit from every movement. Unfortunately, the original version of this technique is only suitable for experienced traders, so here we will look at some of its modifications.
As with any long-term strategy, the system is elementary in nature, but at the same time requires from speculator some knowledge in the field of identification and marking of support/resistance levels. Therefore, in order to save time for the "advanced" users and not confuse novice traders, today we won’t cover the nuances of manual construction of levels, but instead go straight to the rules, after which offer a few versions of the system for those who only study the basics of Forex trading.
Ruler strategy and main settings
Perhaps the main advantages of any algorithm on large timeframes are low costs of time spent on analyzing the situation, opening and further support of positions. In our case, all of the nuances are relevant as never, because the decisions will be taken only after the closing of the day candle without regard to a smaller timeframe.
So, before you mark the levels, you need to configure two moving averages. The first of these will display the average price over the past 10 days (hereinafter SMA(10)), and the second will show a fair price for 200 days (the SMA(200)). Results of this configuration is as follows:
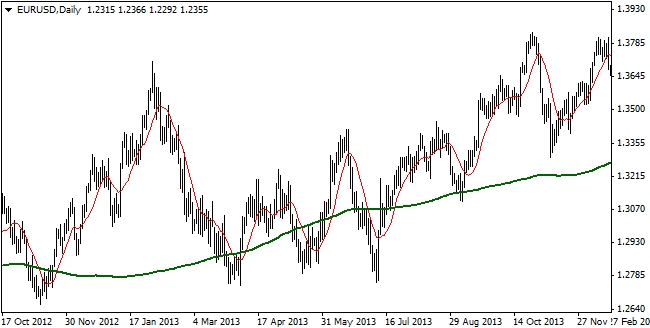
The resulting pattern is recommended to save, as the Ruler strategy is universal and suitable for all instruments, and since the orders will be opened on several currency pairs (in order to increase profits), it gets simply unreasonable to spend the extra time to perform repetitive actions.
Next, you need to prepare the markup of the key support and resistance levels. Here, everyone is governed by their own skills and experience, someone builds a horizontal line, someone analyzes the market profile on the futures market, and we prefer to mark the areas, for example:
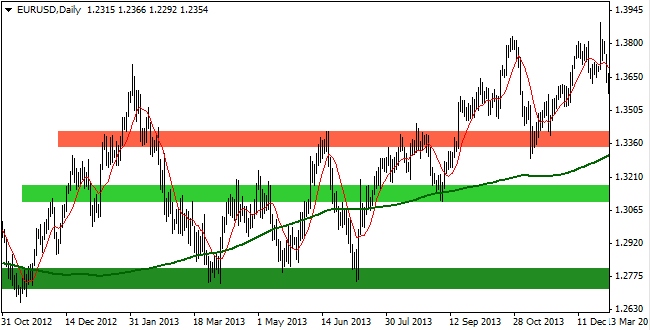
Rules of making deals suggested by the Ruler strategy
The main idea of the whole system is a simple rule: to sell from the resistance and buy from the support, no methods for trading on the breakthrough are applied in this algorithm. Thus, it is necessary to wait for the following conditions for a deal to buy:
1. The price has touched the support line (or the upper boundary of the area);
2. After rebound from the level (or exit from the area), the next daily candle has fixed above SMA(10);
3. Distance to the SMA(200) should be sufficient for price maneuvers and it is desirable that it was moving upwards. Otherwise (if the SMA(200) is in the horizontal position or the price approached it), there is a high probability of a quick reversal of the trend from bullish to bearish.
As you might guess, the Ruler strategy assumes the opposite rules for the deals to sell, i.e. you will need to wait for the touch of the resistance level, a rebound from it and fixing of the price below SMA(10). SMA(200) should also be directed downward.
We have mentioned such a vague concept as "sufficient distance for the price maneuver" above, and the experienced traders probably realize what is at stake, as they are familiar with the volatility of the trading instrument, but beginners are recommended to take a distance of 100 points for the EUR/USD pair as a filter.
Thus, if a distance to the potential entry point from SMA(200) is less than 100 points, it is reasonable to ignore the signal, or go with a smaller lot. Accordingly, for all other pairs, the filter value should be recalculated taking into account the individual volatility. The figure below shows the example of the deal to buy in accordance to all the rules:
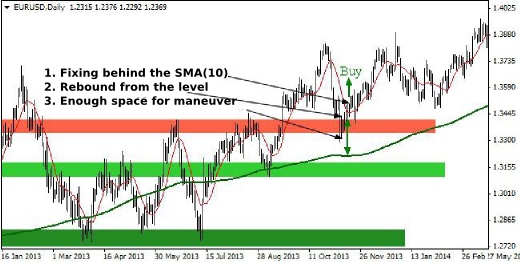
Stop-loss should be placed behind the nearest level, and certain procedures are required to be complied with for the fixing of profit. First of all, we split every transaction into two equal parts, the first of them we’ll close manually later upon reaching the profit of 100 points.
At the same time, we move a stop-loss on the remaining positions to breakeven, and then wait for the moment when the price reaches the strong level, or until it crosses the SMA(10) in the opposite direction to the position. As soon as one of these events occurred, we close the remaining part of the deal.
Ruler strategy in conjunction with the Murray levels
In order to better focus on the market, novice speculators can use level indicators, in particular, Murray levels can be a good assistant, as they are based on the laws identified by Gunn in the early 20th century. The figure below shows the new markup, the levels of which are built with the help of Murray indicator with a period of calculation equal to 200 days:
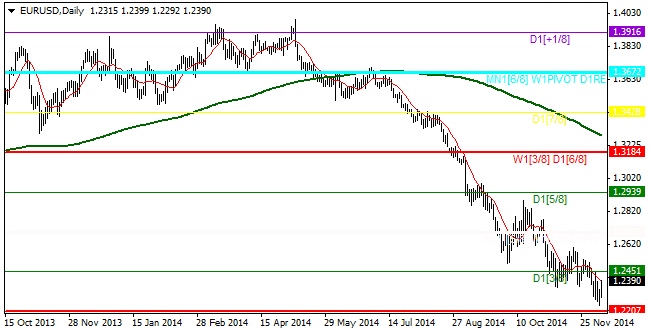
In fact, trading on Murray levels is a separate and very broad topic, but the matter is that the Ruler strategy in this case does not require a detailed interpretation of each level and their presence will be sufficient. In practice, this means the following: we are looking for signals to buy around each support, and are considering opportunities to sell near each resistance.
Accordingly, the support is all levels below the current price, while resistance is all levels above the price, where each of them is recognized as equivalent. All other rules for making deals (filters by SMA) remain in force and are not adjusted.
The main advantage of Murray levels compared to manual markup is that the trader always has a benchmark for future movement that becomes crucial when the market updates highs or lows (i.e. speculators have not yet identified the levels).
Ruler Strategy and Fibonacci levels
Alternative to Murray levels is the Fibonacci numbers and the levels of the same name. With this tool, which is available to anyone interested in the toolbar of any terminal, you can also reveal important levels in the past and look into the future.
Under the rules, a grid of Fibo levels is built from left to right and connects the two extremes: for example, if a trader joined the low of July and August 2012 with a high of spring 2014 on the chart of EUR/USD pair, they would have received tentative support levels for the next six months:
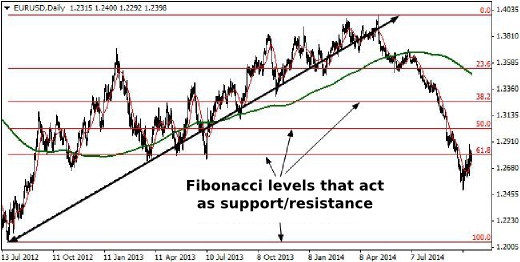
You can similarly apply Fibonacci extension, which allows you to build a projection of future levels. As in the case with the Murray levels, we won’t delve into the theory of these levels, but just note that the Ruler strategy shows the best results if you use the so-called "markup overlap", i.e. if you take the key level as the price at which Fibo levels from different periods coincided.
In conclusion, we note that the above strategy allows to earn though a small but steady percentage of the capital, while it is perfectly suitable to all traders who do not have the ability to constantly monitor the market. Source: Dewinforex
Social button for Joomla


