An approach similar to the usual traffic signal is used in many indicator systems, which warns the driver about the time when you need to stop, get ready to move, and hit the gas pedal. Of course, this analogy in the financial markets has been noticed a long time ago, resulting in the Traffic Light trading strategy.
It should be noted that to date, several versions of this method can be found, the most popular of which will be considered below. But we will start our review with the original version, of course, which is considered to be the starting point for the further development of the algorithm.
So, the Forex traffic light needs only two standard indicators: MACD and moving averages, where the first merely acts as a filter of false alarms, and the rest of the work, from finding entry points to determining the trend, is assigned to the movings with the following settings:
- Red – simple on the closing prices with period 120;
- Yellow – simple on the closing prices with period 55;
- Green - exponential on the closing prices with period 5;
- Two blue (dashed) – exponential in the maximum and minimum prices with period 24.
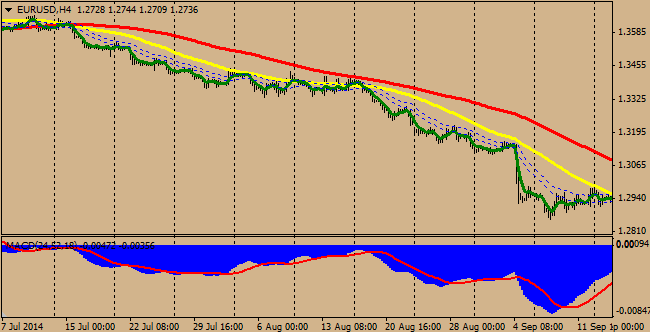
MACD settings (24, 52, 18) can be found in the figure above. As many have already guessed by the parameters (the most of which are multiples of 12 and 6), the optimal timeframe for trading is “hourly”, so we will not deviate from the rules and consider the classic example of a signal to buy (the conditions will be reverse for the signal to sell).
Rules of making deals generated by Traffic Light strategy V.1
Despite the apparent excess of tools, rules of making deals can be described in just a few lines. Firstly, the main lines (in bold) should locate in the following order to buy: EMA(5)>SMA(55)>SMA(120), or, to put it more simply, the green line should be above the yellow and red.
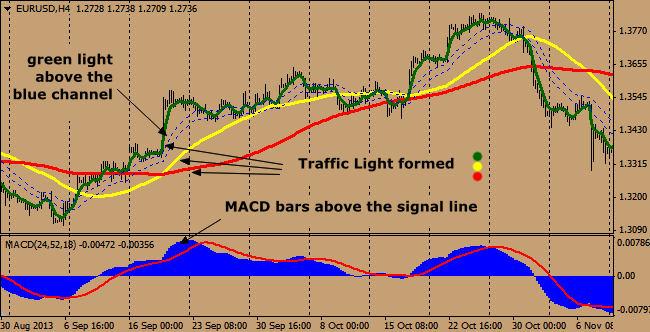
Secondly, the MACD histogram values are located above the red signal line, thus indicating the lack of correction against the trend. It should be noted that this indicator can be useful not only in the moment of the appearance of “green light” – for example, it can be reasonably applied for the timely closing of positions, because if you take profits on the moving average, the “notorious” delay can reduce the effectiveness of the system to zero.
In fact, the point of profit taking was noted above, the only thing you should pay attention to is the blue dashed lines, used by the Traffic Light strategy as a filter. In particular, if the price is “sandwiched” inside the channel, the market is flat, so it is not recommended to make transactions, and it is better to wait for the breakdown of the corresponding boundary.
As for the stop-loss, the community hasn’t come to a straightforward opinion: for example, the author recommends it to be installed behind the minimum (maximum) of the previous day plus 20-30 points, while other traders do not recommend the use of a stop order but suggest always closing the order manually by the reverse signal on MACD.
After a series of experiments and observations, we conclude that the latter are right, because quite often the stop is removed by the false breakthrough, and the hourly chart allows to quietly accompany the position and timely record losses. Briefly summarizing, the first version of the Traffic Light will be characterized by several features:
- firstly, this is an elementary algorithm which can’t confuse by definition;
- secondly, the most reliable indicators are laid in the system;
- thirdly, it is not without drawbacks – the signals are delayed.
Traffic Light strategy in a new incarnation
It’s quite difficult to meet the first version in the vast World Wide Web today, since it was invented before the global financial crisis, which subsequently made its own adjustments to the financial markets – in particular, there were fewer stable driving directions after 2009 and more false breakthroughs. More sophisticated techniques came in place of the simple solutions, designed to increase the accuracy of the signals in the unstable period, one of them was a new version of the Traffic Light strategy.
It is difficult to say whether the goal was pursued to modernize the old method or not, but only the name was left from the previous version, and the strategy became a completely different model designed to trade on the daily charts. To make the signals as accurate as possible, you will need to find and set the following indicators (the values of the recommended settings are indicated in brackets in order):
- RSI Custom (8;55;45) – standard RSI, but presented as a bar graph, looking like a traffic light; HMA Modified (48;38;8) – modified moving average, which changes color depending on the angle of inclination;
- GoldMiner 2 (7;50;6) – another oscillator, designed to analyze the trend on the larger timeframe: respectively, the period of strength of bears is represented by red bars, and the predominance of the bulls – by green ones;
- CCI (14) – standard CCI.
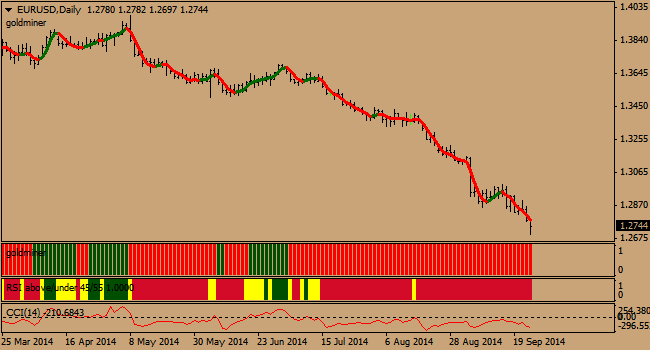
Unlike the previous system, the new Traffic Light strategy consists of two modules, one of which defines the trend and the second is only intended for the search of entry points. For a better understanding of the situation, let’s consider the criteria for the purchase again (the rules will be diametrically opposed for the deals to sell):
- GoldMiner and HMA Modified changed the color to blue (this is the first module – the identifier of the trend);
- RSI Custom bar stained green. Please note that if the trend has changed to bullish, but the color of the RSI remained yellow, this is not yet a signal, but just a notice to be ready to open the order;
- CCI should be above the zero level.
The rules of setting stops are also different from the previous version – in particular, the safety order is recommended to be set behind the nearest local extreme, in this case – behind the low. If in the first strategy this tactic was a failure, in this case it is much more efficient, because the operations are not done on the hourly but on the daily chart, the levels of which are more reliable.
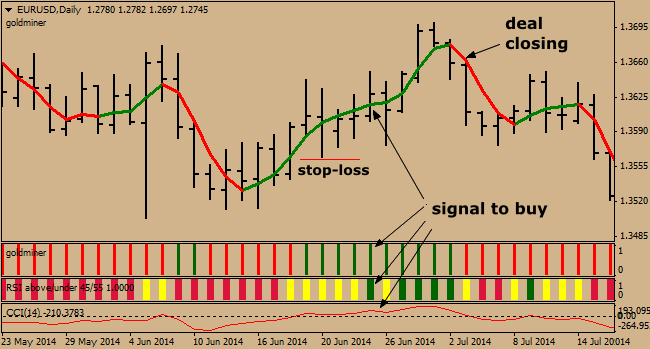
But lucrative positions are closed in a similar manner, i.e. at a corresponding signal, which can be either a change of direction to the HMA Modified, or the intersection of the CCI indicator and zero mark in the opposite direction.
In conclusion, we should note an important moment: due to the fact that the initial version well indicates medium-term trends, and new modification recognizes the long-term trend, it is reasonable to combine the two versions of the system under consideration, in particular, to enter into all transactions by the signals on the H1, but only in the direction of the trend on the D1. If the systems signals are in conflict, the order is better not to open. Source: Dewinforex
Social button for Joomla


