

")
Using Renko charts is quite a peculiar approach to Forex trading. It is a form of the price dynamics and price trends expression in different flats than the time intervals. The time, of course, is present as a factor, but not in the first place. That is, while a simple price candlestick chart reflects the behavior and dynamics of prices based on the time frame, the Renko chart is based on another dimension – namely, on the price movement measurements. Thus, no matter how much time has passed, the price movement will be reflected by the next candle only after price passing ten points. Such approach is not just another dimension – it is an entirely new strategy named Renko charts.
As shown in the pictures, all candles are of the same size. This suggests that each of them has a size of 10 points. Moreover, each subsequent candle may appear in an unknown amount of time, as it will be detected only after its sizing.
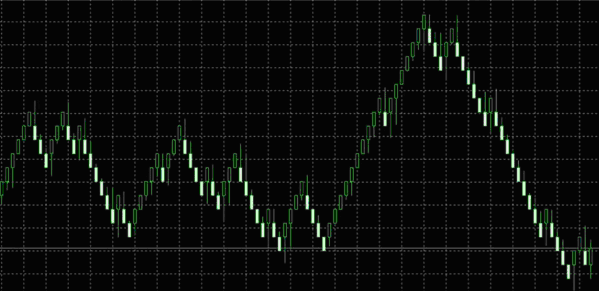
If such price movement measurement is regarded as Renko charts, one advantage should be noted: this trading strategy minimizes the reflection of sideways trends, or rather converts them into brighter sideways trends. In other words, the market noise everyone used to observe will as much as possible be converted to trend movements, though not big ones. The charts are much "cleaner" and "brighter" in terms of trendy directions.
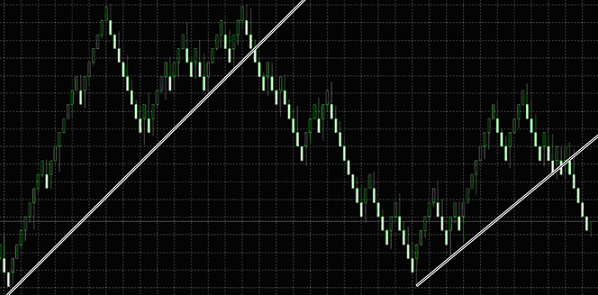
The image below shows how Renko charts remove the excess noise movement and a kind of "cut" them by connecting bright upward and downward movements. A sort of graphic "montage" occurs. Of course, the question remains over how long does it happen? But the answer also has an acquittal character. After all, we often wait for the trend movement. Then what's the difference?
Renko charts imply the use of indicators, which in their turn will also work on the basis of actual price movements. That is, sideways trends will be considerably reduced, which would stimulate the indicators to pronounce trend signals brighter.
Renko charts, expressed exclusively with movements dynamics and reducing sideways trends graphics to a minimum, make the use of trend indicators like Alligator or MA much more effective. While an ordinary candlestick chart shows Alligator “sleeping” in sideways trends without any trend movement, Renko shows it differently. When applied in this strategy, Alligator will show bright upward or downward movement, fading or falling “asleep” on the move sometimes, while showing the movement trend in the right direction and further. This will allow not to quite the market and not to close orders too early.
In such a way, this strategy provides for theoretically a very successful trading, but as a chart with absolutely different dimension, Renko requires a long time adaptation period. Source: Dewinforex