EUR/USD
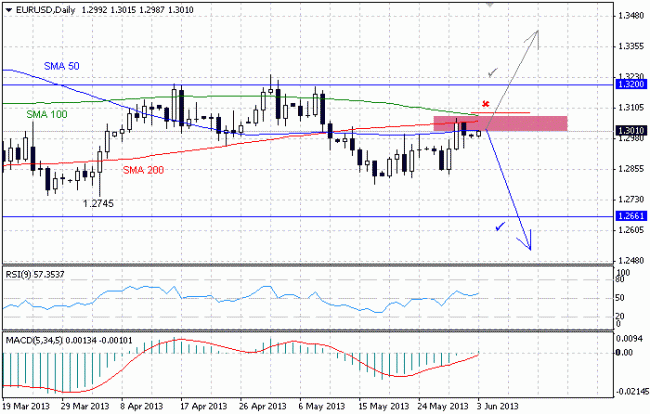
Pic. 1. Daily graph
Currency pair EUR\USD is still under the resistance of levels of 1.3010 and 1.3075. Here we are watching the stabilization of 50-, 100- and 200-daily SMA. In that case one should expect the rehabilitation of descending tendency after passing the mark of 1.2745 and fall of the currency to 1.2660, where most likely the consolidation will be. If the bears take over the situation, a strong descent to the level of 1.2040 is planned.
The deployment of the market is considered in case of passing the barrier of resistance at the levels of 1.3010 and 1.3075 and the growth of currency pair to the level of 1.3200. Then a strong bursting and movement upwards to the level of 1.3710 is possible.
The main technical levels are: 1.3178, 1.3129, 1.3110, 1.3068, 1.3050, 1.2977, 1.2956 и 1.2917.
To open long positions is recommended with the rate 1.3068 and to close it at the level of 1.3110, further from 1.3130 to 1.3175. It is better to sell from 1.2975 to 1.2957, further from 1.2950 to 1.2917.
GBP/USD
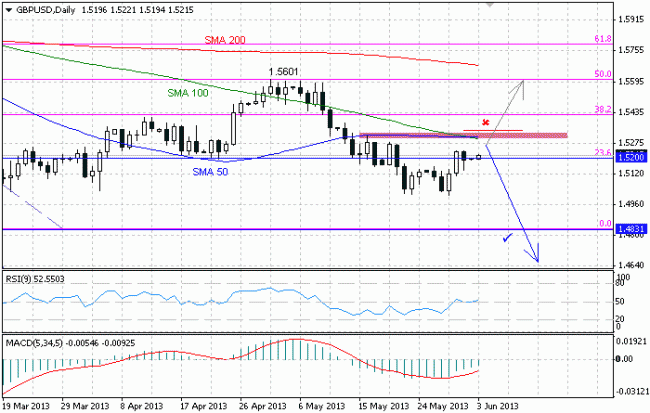
Pic. 2. Daily graph
Currency pair is trading within the diapason of 1.5200. Investors make bets on currency growth to the level of 1.5300, this is how 50- and 100-daily SMA are placed. In case of positive developments there might be a steady growth to the 1.5600. Otherwise we are going to see the following situation: the lowering of currency to the level of 1.5000 to the level of 1.4830.
The main important technical levels are: 1.5366, 1.5314, 1.5293, 1.5252, 1.5195, 1.5176, 1.5145, 1.5129 and 1.5022.
One may buy at the rate of 1.5252 to 1.5293, further from the level of 1.5315 to 1.5365. It is better to launch short positions from 1.5195 to 1.5176, further from 1.5174 to 1.5145.
USD/JPY
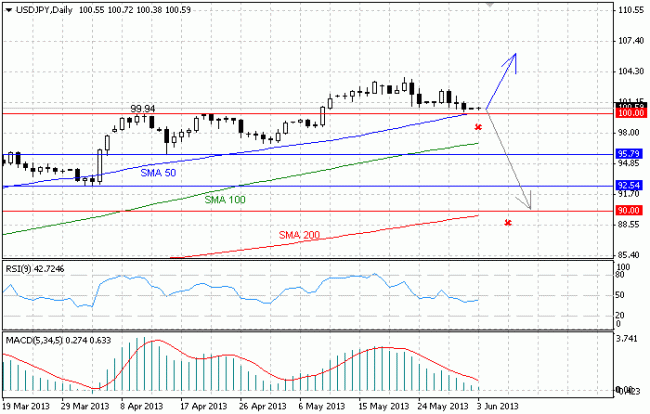
Pic. 3. Daily graph
Currency pair is under the pressure of the level of 104.30, however the trades are led near the level of 100.00, where the signals of 50-day SMA are. Now one may say that there is a possibility of market growth and the movement of the currency to the level of 110.
Future currency descent is observed from the support of 100, which will mean formation of prolonged correction to the aim of 90.00.
It is recommended to trade within the following technical levels: 103.73, 103.18, 102.69, 102.30, 100.80, 100.13, 99.01 and 98.57.
It is more reasonable to buy with the currency rate of 102.30 and fix takeprofits at the level of 102.69, further from 102.73 to 103.18. One may sell from 100.80 to 100.15, further from 100.10 to 99.05.
AUD/USD
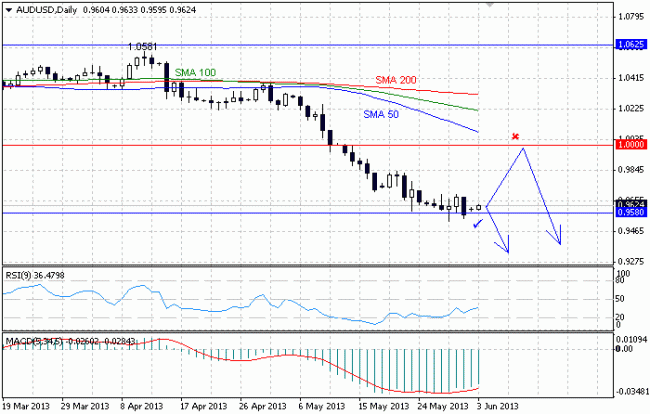
Pic. 4. Daily graph
Currency pair is still holding its positions higher than 0.9580, but it is still not clear foe how long it will be able to do so. The future growth is considered to the resistance of 0.9700, where the rebound and deployment towards the descending tendency are possible. With a stable breakdown of 0.9700 the currency will move upwards to 200-daily SMA.
Now one can talk about the beginning of a new descending movement lower than the level of 0.9580 to the first aim of 0.9385. Currency pair will most likely stay at the levels of 0.9791, 0.9710, 0.9525, 0.9442, 0.9405 and 0.9325. To put Buy orders from 0.9710 to 0.9790, Sell orders from 0.9525 to 0.9445, further from 0.9405 to 0.9330.
Social button for Joomla


