

")

At present energy resources are the most important commodity for the world economy as they are used practically in all branches. Such popularity led to the fact that CFD on oil have become more favorable than some currency pairs.
Why? The matter is that black gold is not just blood of the modern economy, it is used almost in all branches, from the chemical industry to the production of medical supplies and what to tell – if there is no diesel fuel, today a half of the Globe would suffer from hunger.
Before passing to the studying of the oil market and concrete speculative methods, it`s necessary to deal with specifics of CFD on oil as many traders don't see distinctions between similar contracts and real physical commodities.
In general, CFD are the special financial derivatives, in case of purchase/sale of which there is no supply of real raw materials, that is the buyer and the seller conclude the «paper» agreement that at the time of closing of the transaction mutual settlement will be made, i.e. the party which forecast was incorrect will pay a difference of the prices to the contractor.
Last century such transactions were concluded seldom and were always followed by documentary execution, but today contracts for a difference are emitted in an electronic form. CFD on oil and other energy resources didn't become an exception to the rule, moreover, today it is the only raw asset which is included in the specification almost of all dealing centers.
As for the quotations formation principle of «contracts for difference», everything is simple – they point in point correspond to the prices of the futures of the same name which are traded in Intercontinental and New York Commodity exchanges, therefore, actions of CFD traders don't exert any impact on the cost of a basic asset.
Thus, during the work with CFD the parties of the transaction (buyers and holders of contracts) have no obligations for delivery and acceptance of real oil after the corresponding future is expired, and also there are no additional problems caused by low liquidity, i.e. at any moment the trader can buy/sell infinitive number of contracts.
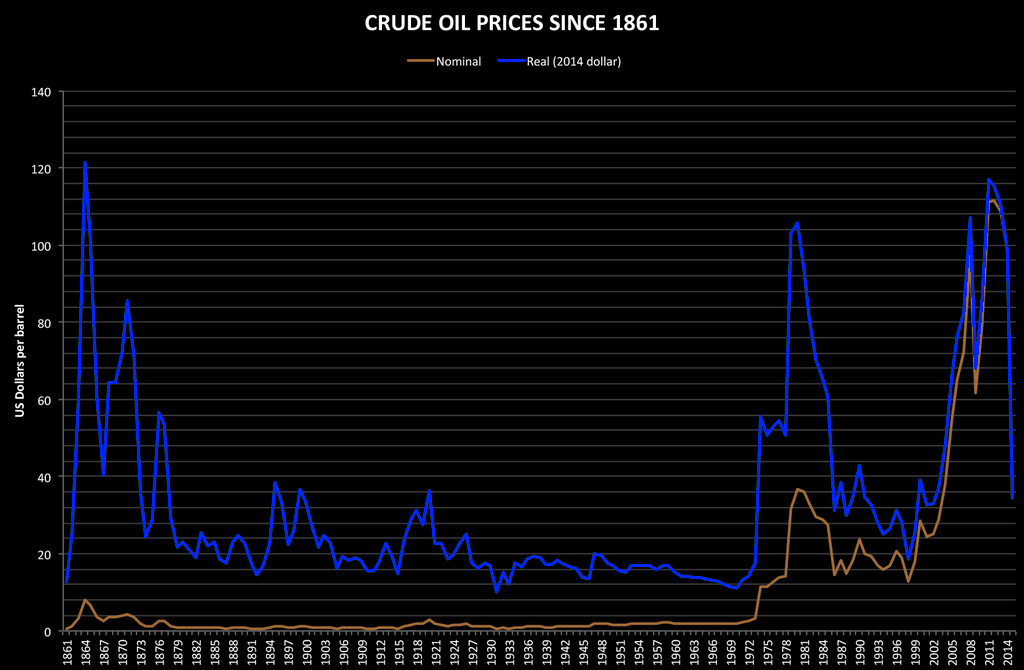
Some facts from history of the oil prices
At the beginning of origin and development of oil branch price of oil was established by oil monopolies. In the USA first it was done by the Standard Oil company, after − the Texas railway committee.
At the following stage of development of branch of the price of the extracted oil were dictated by «seven sisters» − seven oil companies dividing among themselves the world oil market. Five of them were the American companies (Exxon, Mobil, Gulf, Texaco, Standard Oil Company of California (SOCAL)) and two European (the English British Petroleum and the Anglo-Dutch Royal Dutch/Shell). In 1928 they have created the International Oil Cartel (IOC), having ensured control of 85-90% of all market of oil.
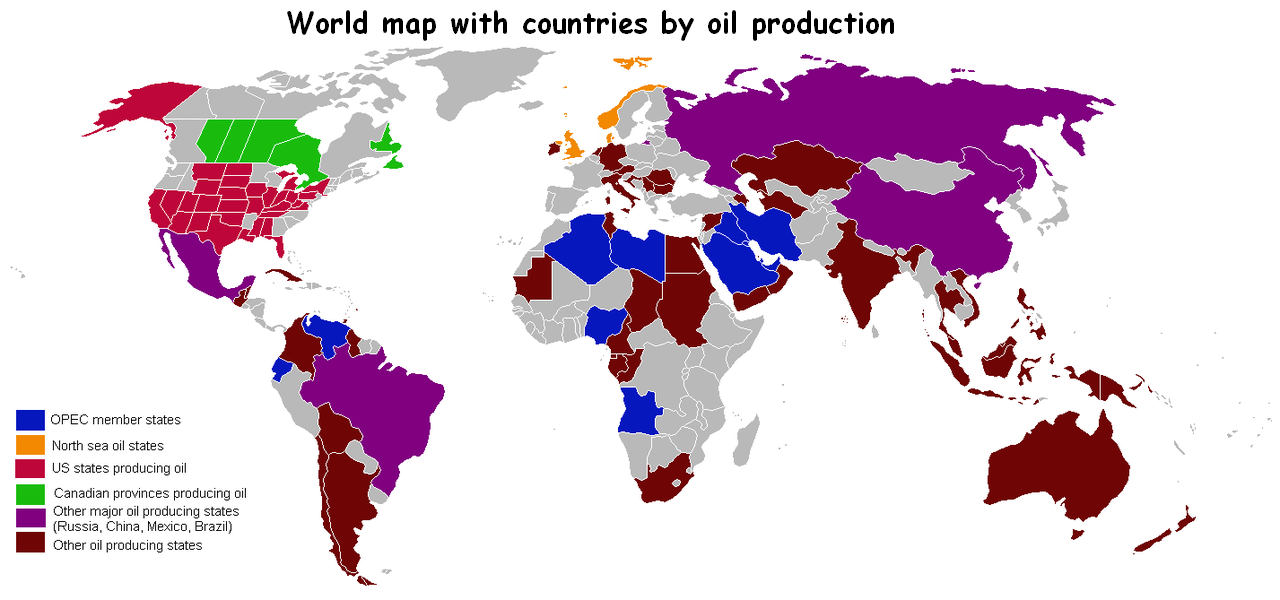
From 70th years of the twentieth century the power over the prices has passed to OPEC (Organization of Petroleum Exporting Countries). The power of OPEC lasted rather not for long as in 1983 on the New York Mercantile Exchange future contracts for crude oil have been entered into practice. Future contracts are favorable both to the buyer, and the seller as both that and another, concluding the contract, insures itself(himself) against risk of the considerable change in price for goods.
First introduction to practice of future contracts in the oil industry has been met skeptically and is even hostile. But soon this practice has widely extended both most the oil companies and some export countries have joined in process.
Specifics of CFD on oil, gasoline and heating oil
As we already noted, «contracts for difference» take as a basis quotations of the futures of the same name, therefore, acquaintance to this market should be begun with time tools as their prices should be analyzed further.
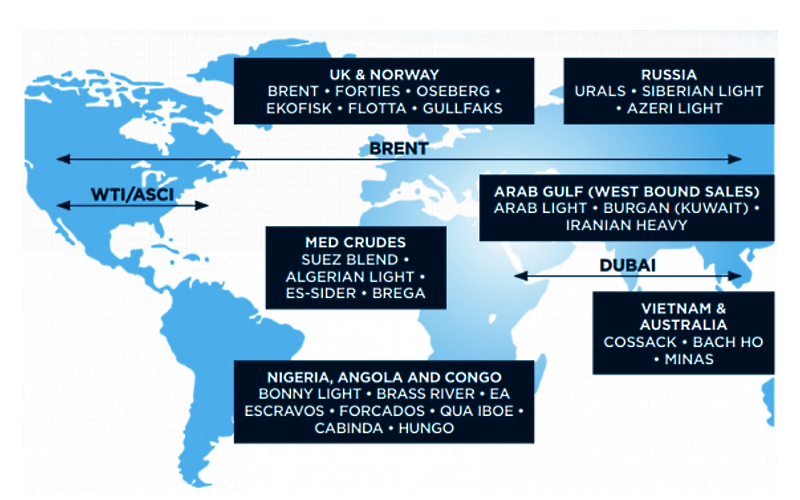
It`s possible to trade by two reference brands of oil, WTI and Brent, on modern exchange platforms. First of them is got in the State of Texas (USA), and the second characterizes features and other parameters of the energy resources got in the North Sea. Respectively, each of them is presented in terminals under own ticker.
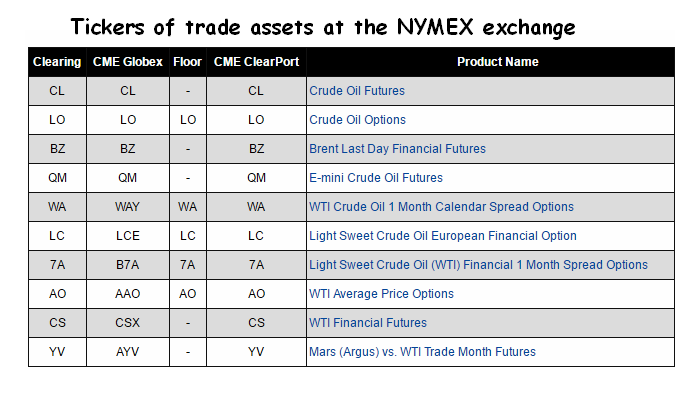
CFD on WTI oil meets under various designations, the most widespread of which are WTI and CL. As for the Brent brand, various options are possible, but two subspecies are most often in the dealing centers – BRN (the futures traded on ICE are taken as a basis) and BZ (quotations of settlement contracts from the New York Exchange).
Besides, some companies use own tickers, for instance, the USOIL and UKOIK codes are widespread, i.e. «the American oil» and «the British oil», but their quotations completely correspond to a data flow according to the futures mentioned earlier.
Thus, in spite of the fact that by nature the WTI and Brent brands are the same raw materials from which receive similar chemical products, their prices can differ considerably as dynamics of offer and demand in the regional markets will significantly depend on specific factors, but we will talk about them a little later.
As for CFD on gasoline and heating oil, in this case, everything is much simpler as the future contracts put on their basis are traded only on NYMEX, therefore, they generally depend on tendencies in the US economy. In TCs terminals, similar tools meet under tickers HO (heating oil) and RB (gasoline).
The CFD on oil analysis – collecting primary information
Before opening the order for oil purchase/sale, it`s necessary to estimate the general tendencies in the market of energy products, in particular, universal macroeconomic factors impact on dynamics of both reference brands of «black gold».
Firstly, the oil prices directly depend on tendencies in industrial and consumer sectors of the world economy as the simple formula is worked: demand for goods grows – the need for raw materials and energy carriers increases, oil is not only fuel but also the product which is necessary for production of synthetic materials (plastic, rubber, polyethylene, etc.).
By the way, the powerful ascending trend in the oil market which was observed from 2000 to 2008 has been caused just by real physical demand for energy from China. Economists have even invented the special term for this period − «super-cycle».
Everything is logical and clear, but there is a question – where can we take information on a situation in processing industry? As a rule, official statistics, which is monthly published by the ministries and is reflected in Forex calendar, is enough for primary estimation.
On the other hand, CFD on oil – the tool rather popular, therefore, specialized reports are formed for power branch, in particular, every week US Ministry of Energy publishes data on commercial stocks of energy resources and percent of loading of refinery capacities.
Such data should be used very carefully because the fact of decrease in stocks within a week doesn't guarantee yet that demand for raw materials will increase, but the last years have shown that overstocking is always followed by decrease in quotations of «black gold», that is in the modern market the buyer, but not the seller, dictates the terms.
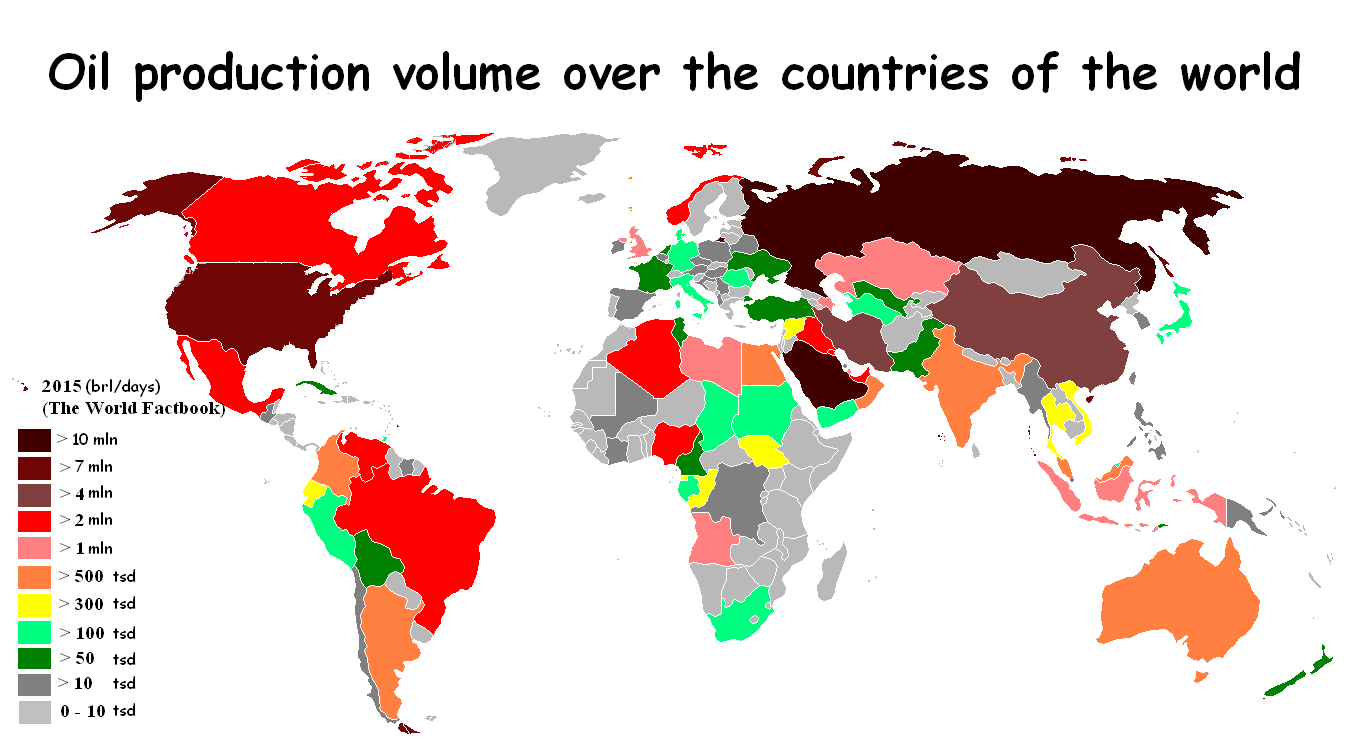
Secondly, the oil prices sensitively react to a sharpening of geopolitical tension as large reserves of raw materials are concentrated in regions in which local armed conflicts don't abate. You can find the mass of examples (Libya, Iraq, Sudan), and indirect signs indicate also possible failures in Nigerian deliveries.
Thirdly, CFD on oil are nominated in US dollars, therefore, their prices significantly depend on USD dynamics. As a rule, the regularity is expressed in the following − if the main reserve currency becomes stronger, energy becomes cheaper, if the dollar hands over positions – raw materials rise in price.
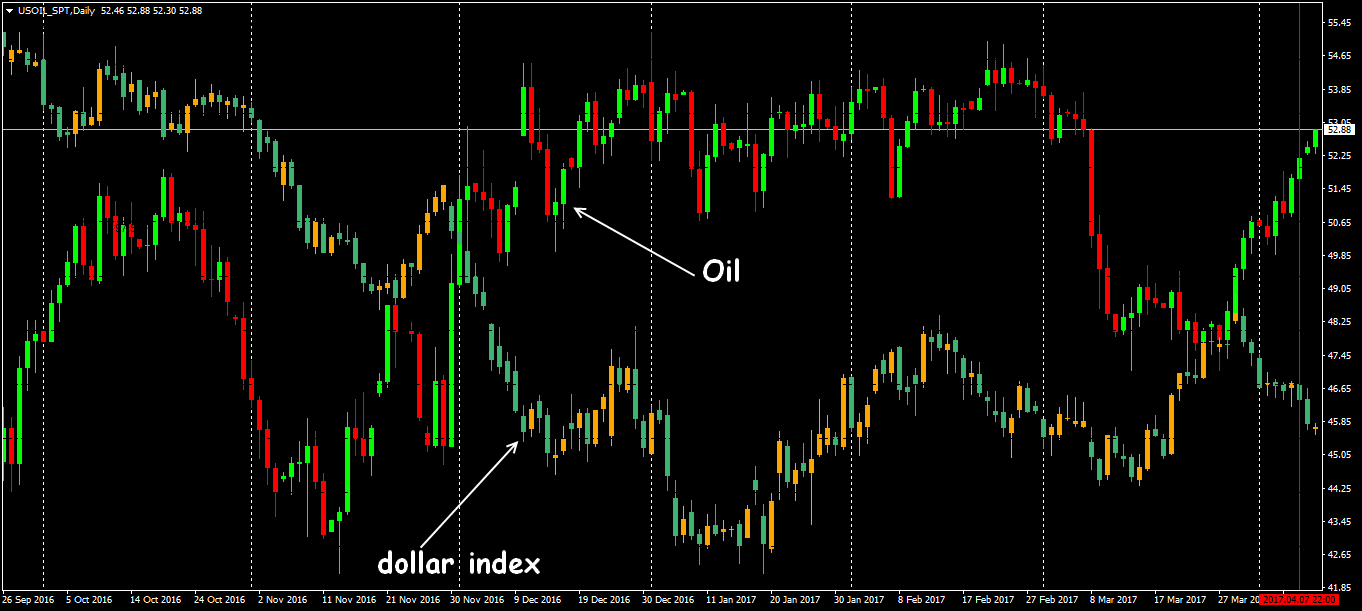
If to consider the factor more detailed, the analysis will be displaced in the field of FRS monetary policy as dollar exchange rate significantly depends not only on speculative factors, but also on actions of the main financial regulator of the United States.
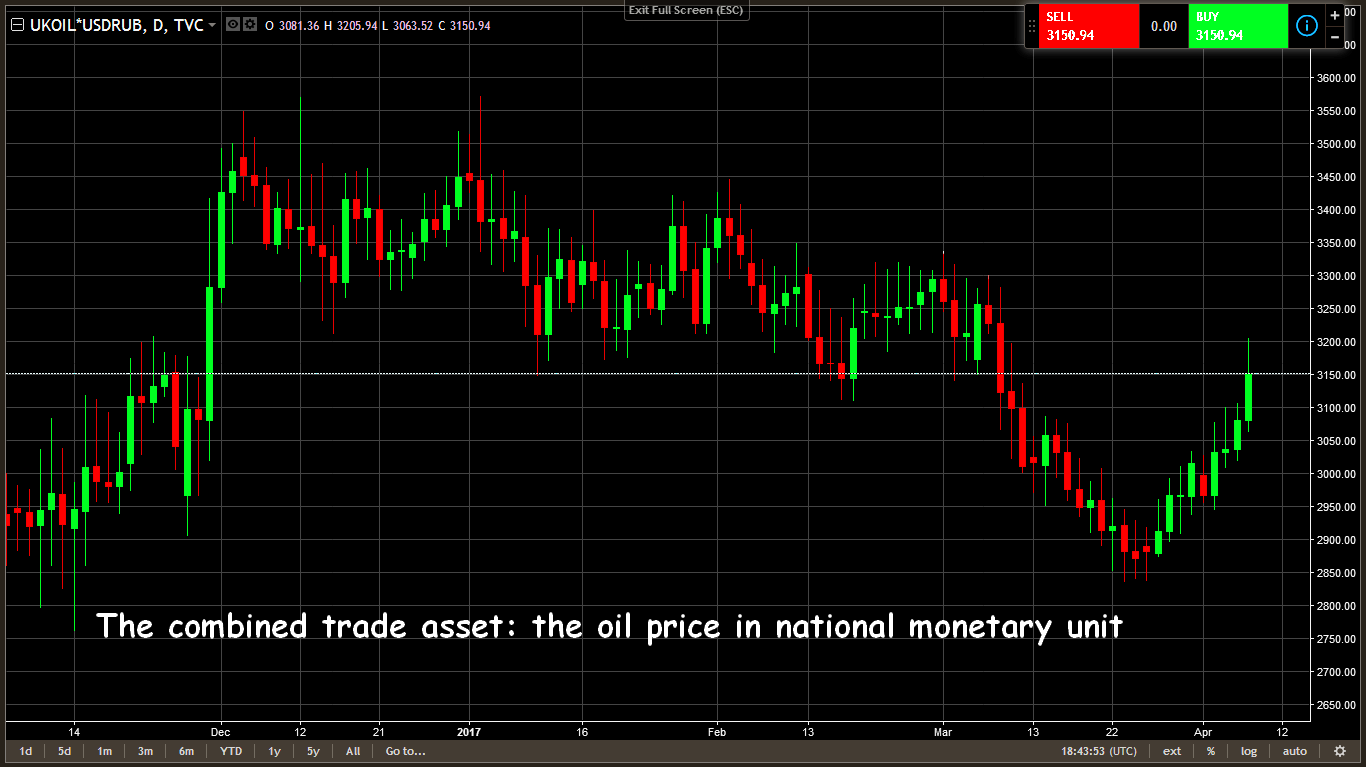
After the influence of the general factors has been estimated, it is necessary to study a news background on each region, i.e. separately in the USA and Europe. The matter is that the divergence (spread) on which it is possible to earn is often formed between the prices of WTI and Brent.
The seasonal analysis of CFD on oil, heating oil and gas
As well as all other commodities, energy resources are subject to the influence of seasonal factors. We will remind, seasonality is a complex of the phenomena and events leading to the predictable growth or reduction of prices of a basic asset throughout the studied time interval.
We already focused attention on seasonal trends on pages of the review of CFD on commodities, but till regularities only in the agricultural sector and the forest industry were considered. The similar principle acts on the oil market, only in this case the prices are tied not to concrete stages of a production cycle, but to cyclic fluctuations of offer and demand.
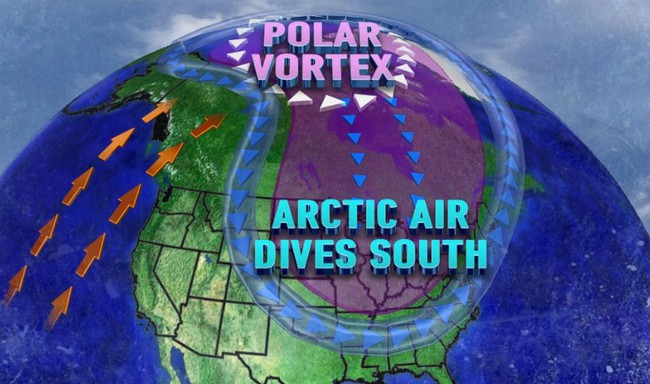
It should be noted that in recent years the given regularity has an effect even more often, meteorologists have even introduced into circulation the special term – a polar whirlwind which called the climatic phenomenon bringing strong frosts to the region of the Great Lakes.
The similar picture is observed also on heating oil as this fuel and is used for heating of private houses, industrial buildings, and also applied to power generation (in the winter night much longer, than during the summer period – this factor also affects the prices).
After the end of the winter period, the up-tendency on CFD on oil often proceeds till June as the need for fuel increases in the spring, in particular, demand for gasoline grows prior to so-called «automobile season» – the period when Americans begin to travel around the country actively.
In this case, the companies owning gas stations try to fill in advance storages as in the peak of a season wholesale prices of gasoline reach the «peak» values – that is the reason of quotations growth in April/May when motorists just prepare for holidays.
As for diesel fuel, the similar principle works here, only this time the main buyers of fuel are not motorists, but farmers, transport companies, the mining enterprises and other subjects, which are used the large and powerful equipment.
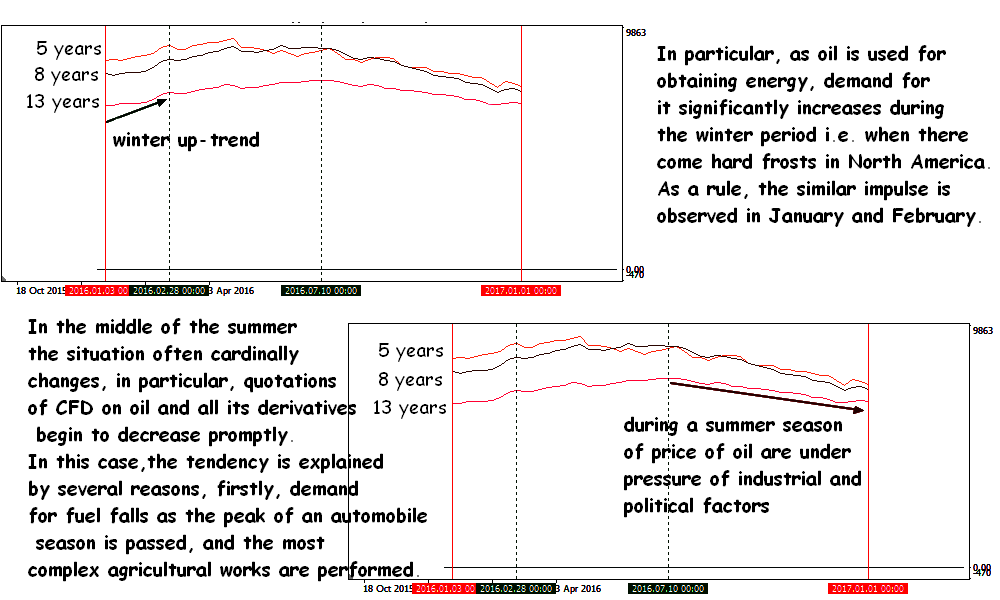
Secondly, in spite of the fact that in hot months the need for the electric power for conditioning increases, the generation companies prefer to use not heating oil, but natural gas as in the USA it rather cheap and allows to avoid problems with environmental monitoring.
And, thirdly, the volume of the offer of oil and oil products is at the stable and high level as it is simpler to get and transport raw materials, especially in the northern hemisphere (the USA, Canada, the North Sea, etc.) in the summer. On the other hand, demand is less elastic as it depends on dynamics of all World Economy, therefore, the companies and the plants often work «for a warehouse», i.e. download energy resources in storages.
Thus, such tendencies allow to identify the preferable direction for transactions, in other words, if long-term regularity contradicts a technical picture, it is reasonable to refuse speculative operations, but in opposite way, that is if the technique coincides with seasonality, the probability of fulfillment of a signal considerably increases.
CFD on oil and spread trading
As it was already noted earlier, due to impact on moods of bidders by specific factors, the prices of different brands of oil or products of oil processing can significantly «disperse». In other words, if to tell in statistics language, the temporary over correlation of assets is observed then quotations begin to move within the general global trend again.
The similar difference between the prices of related assets is called «intercommodity spread». It is necessary to pay attention to the fact that this term has nothing in common with a habitual difference between ASK and BID quotations, information on which can be met in the specification of tools.
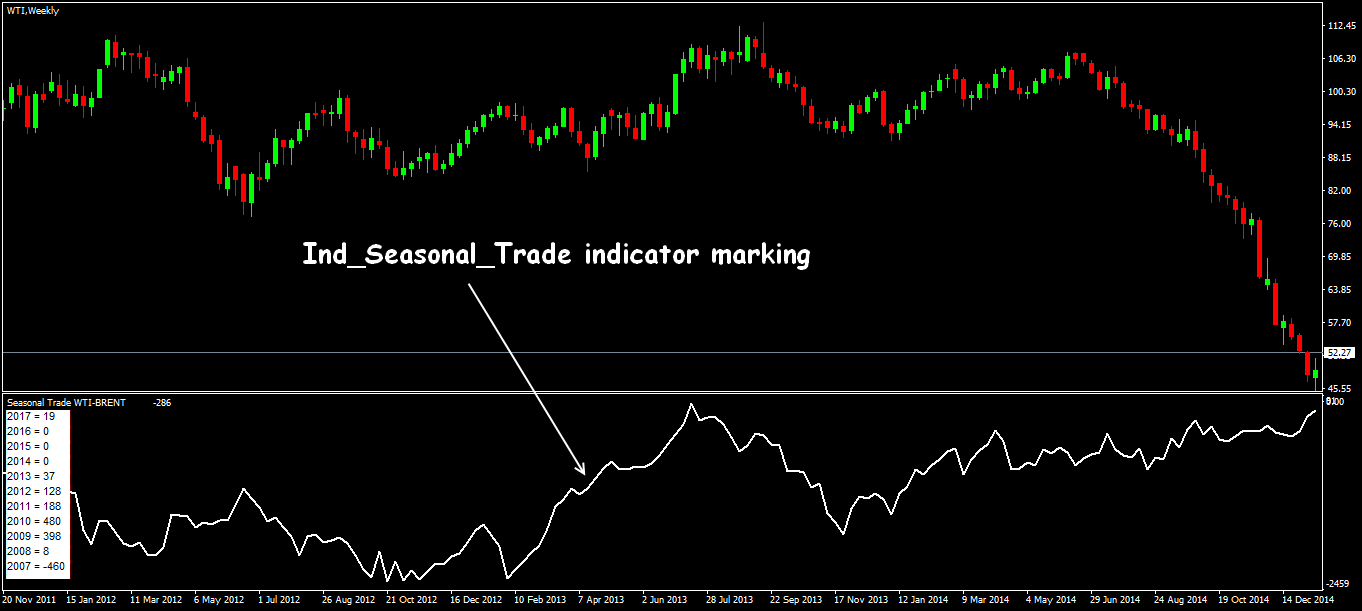
Unfortunately, possibilities of the MetaTrader4 terminal are very limited and don't contain many functions available in popular exchange platforms, therefore, the spread between CFD on oil should be built by means of auxiliary indicators, one of which is called Ind_Seasonal_Trade.
We already worked with this algorithm when built seasonal tendencies, but his functionality allows to solve a set of problems, in particular, for the program construct a spread between Brent and WTI oil brands, it will be required to perform several simple operations:
- we open the chart of the main asset which ticker will be with the sign «+» (in our case it is BRN);
- we install the indicator on working space of the opened chart.
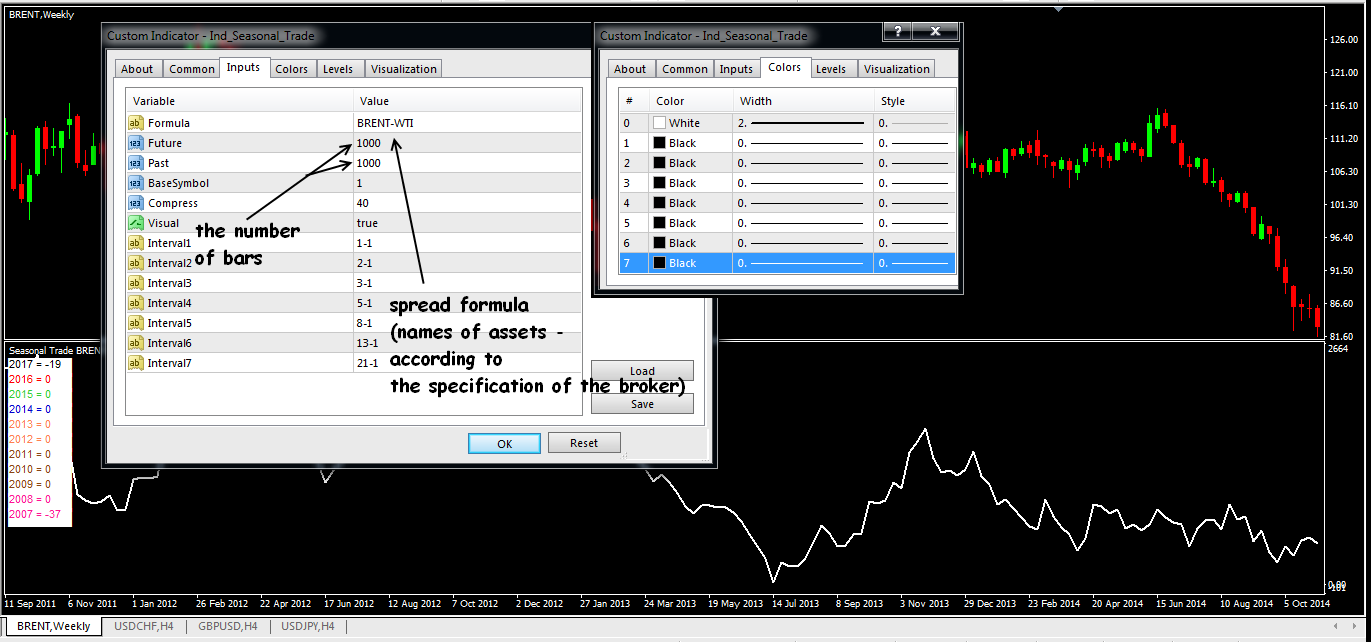
In a pop-up window, we set a formula of calculation and decolour all lines, except the main (by default it is highlighted «in bold»).
As a result of the listed actions the synthetic tool reflecting an absolute difference (in dollars) between the BRENT and WTI barrels prices will turn out, but there is a natural question – as it is possible to use the information in practice?
Now oil spreads are used rather often as in speculative, and investment strategy, in particular, they allow to compare appeal of stocks of the American and European mining companies, namely if «Brent» rises in price in relation to the «Texas» oil, it is expedient to buy papers from Europe, but not the USA.
Secondly, as the spread between CFD on oil fluctuates in a certain corridor, it becomes attractive to the conclusion of transactions from his limit borders as in this case the trader has a chance to open a position with a high ratio profit/risk.
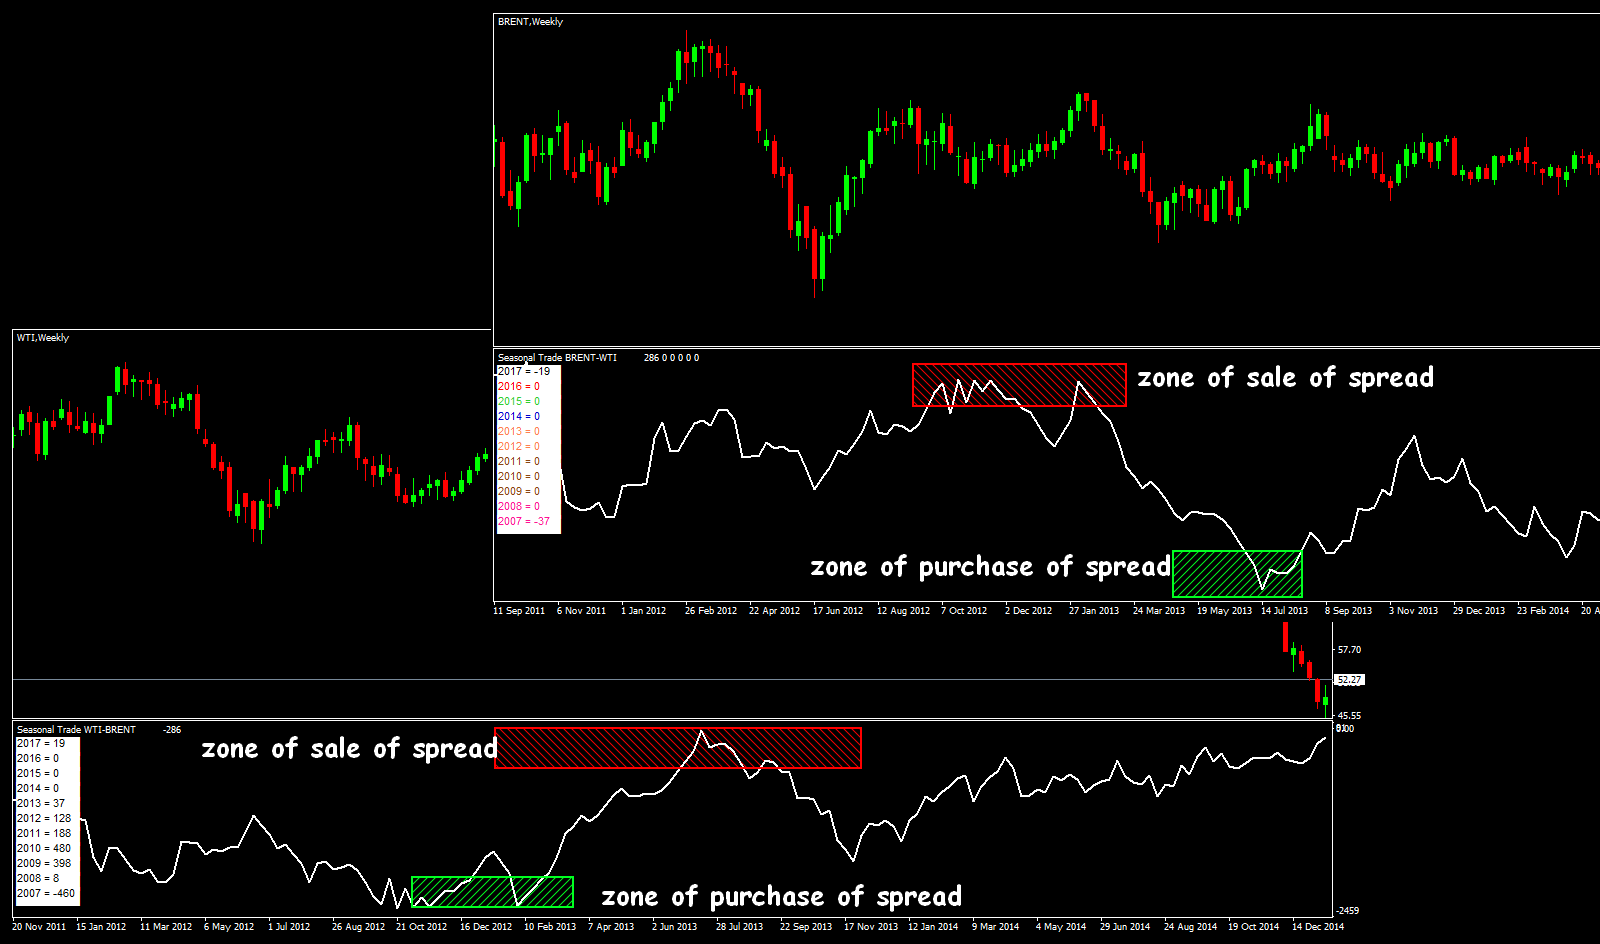
We would elaborate upon specific time frames as the spread behaves differently on different time ranges. The marking on W1 is given on graphics above − it is classics of spread trading as the obvious range of fluctuations is visible only at large intervals.
It is connected with the fact that the divergence between CFD on oil depends mainly on a situation in the Middle East and in Africa. In particular, when geopolitical uncertainty increases, demand for Brent considerably increases as deliveries of energy resources to Europe can be broken, at the same time in North America the market functions in the normal mode, i.e. the need for WTI remains at the previous level.

If to focus attention on the chart once again, it is possible to notice that the spread has significantly grown just after operation in Libya when the offer of oil in the water area of the Mediterranean Sea was significantly reduced. Further splashes have been recorded during an aggravation of the conflicts of Syria and Northern Iraq.
Thus, if in Africa or in the Middle East the new centers of tension are formed, it is expedient to buy CFD on Brent oil and at the same time to sell equal amount of WTI – such tactics allows to be protected from casual speculative fluctuations before which single contracts are vulnerable as sometimes «base» is stronger than geopolitics.

´If to consider smaller time frames, then transactions with spread become riskier as ranges are more often broken, and steady trends are formed on the most synthetic indicator. Nevertheless, even in such conditions, it is possible to earn if to make decisions after the analysis of the important regional news.
The rapid decrease in the spread of BRN-WTI in the summer of 2013 when in North America the new oil pipeline has been started may be an example. In the designated interval demand for the Texas oil considerably has grown, as has affected dynamics of the synthetic tool.
And the last popular strategy, the third, is focused on a search of seasonal regularities. The matter is the weather impact considerably on demand and volume of deliveries (we already spoke about it above) due to that the predictable movements are often formed on oil spread.
Similar impulses can be used just as also seasonal trends on single CFD on oil, that is to buy BRN and to sell WTI during the periods of growth of a synthetic course, and to make the opposite operations during its decrease. To be fair it is necessary to notice that fulfillment of these signals on the spread is much higher, than on usual contracts, as it isn't so vulnerable to strong trends in all raw market.
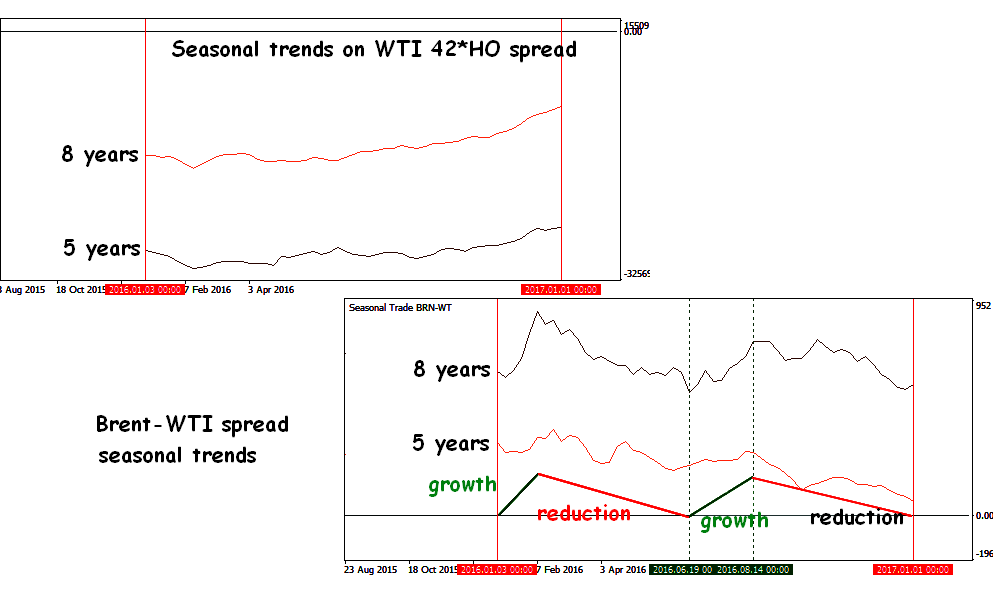
And if to speak about spread trading on energy resources, it is necessary to mention about a divergence between WTI oil and heating oil as the last in the USA is rather popular raw materials for heating and development of energy due to that its prices react to seasonal inquiries of consumers more sensitively.
In this case, transactions are concluded by the similar principle –we look for strong trends on average tendencies, then we buy or sell the corresponding spread. The only thing that needs to be focused on, is the dimension of formula components as the price of oil is specified in dollars for the barrel, and heating oil is quoted in dollars for a gallon.
So to avoid wrong divergences between CFD on oil and heating oil, the spread will be calculated as a difference between the cost of 1 barrel of WTI and 42 gallons of heating oil (one barrel of oil on volume is equivalent to 42 American gallons).
Brief conclusions
Where and from where oil flows? The answer to this question depends on a difference of the prices of various brands, and today the situation is optimum for everyone, except Middle Eastern producers. Petrotraders get quite good arbitration profit because of rather narrow spread of EFS against the background of the low cost of a freight and willingly sell to Asia oil from the North Sea. The narrowly spread, the more willingly Asian consumers buy easy brands of oil which cost is tied to the price of Brent, reducing at the same time import of heavier brands with the high content of sulfur using Dubai as a standard.
CFD on oil, as it was possible to be convinced, give wide opportunities for speculative and investment decisions. Partly, such popularity is caused by high volatility, but it is impossible to ignore the fact that oil is the only raw asset which is available almost in a line of each broker platforms.
As for advantages of oil contracts in comparison with currency pairs or other assets, it is necessary to notice that they are more predictable from the point of view of the fundamental analysis, especially if it is about intercommodity spreads.
Social button for Joomla