

")
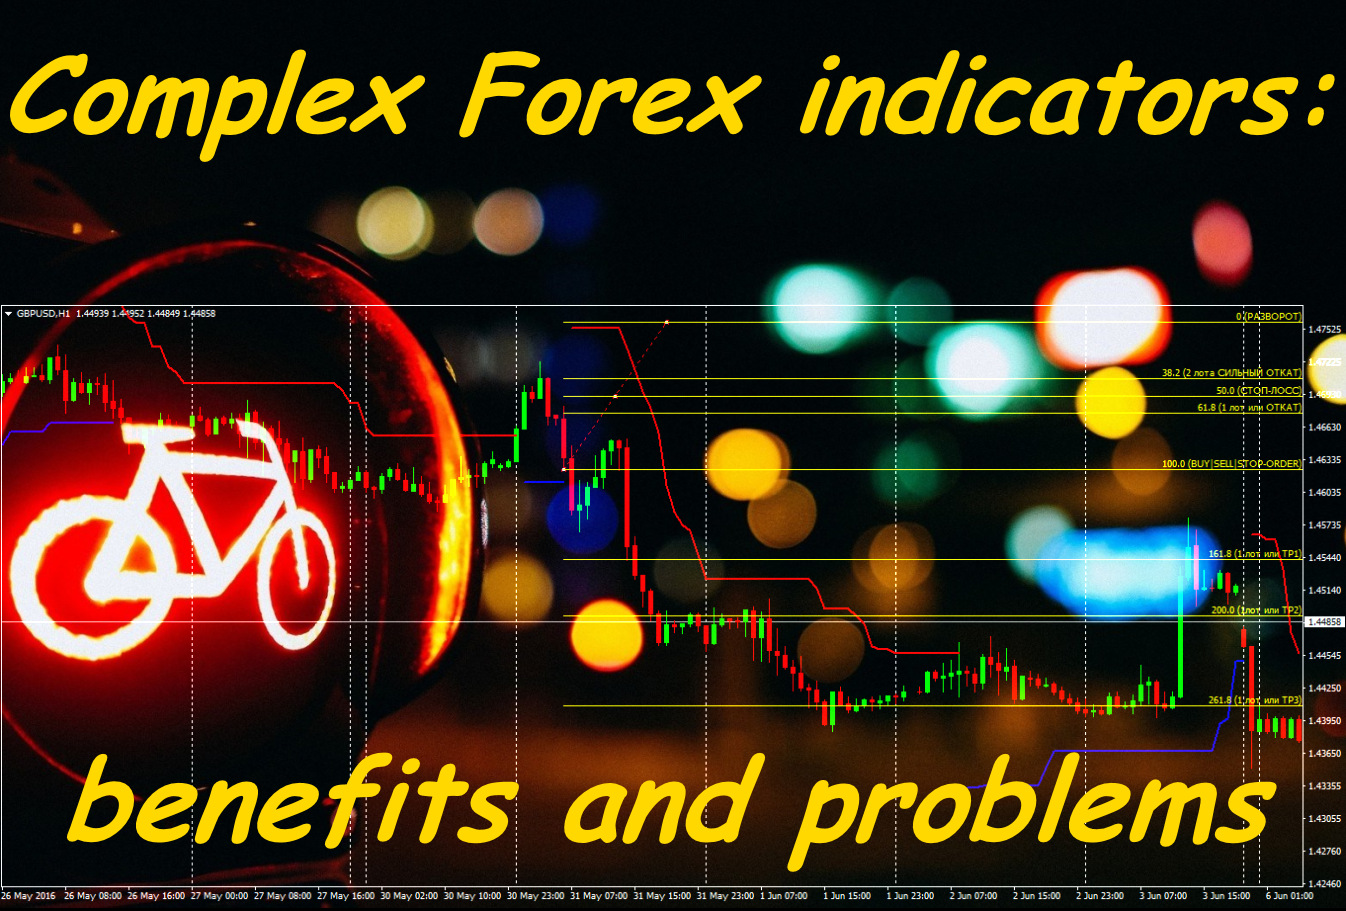
Any technical indicator is the mathematical transformation of asset parameters (price + amount + time) for the forecast of price movement. How to integrate correctly several standard techniques into complex Forex indicators to carry out the multiple-factor analysis and to achieve the most probable trading signal?
It is considered that using of difficult calculations increases chances of success, but at the same time, unreasonable information «loading» of the working terminal doesn't yield a result. It may occur at the beginner (or the Forex guru-swindler), the price isn't visible on the screen behind graphical creations. At the same time, it is extremely difficult to analyze signals of several tools, especially in case they adjusted incorrectly they, in general, contradict to each other.
All indicators pursue two purposes − to increase the efficiency of the technical analysis and to execute the correct interpretation of results of this analysis. You should create complex Forex indicators to optimize calculations and also to clear the terminal screen of a set of graphical creations and additional data.
Main requirements to indicators
These days such tools is an urgent modern trend for programmers and a chance of the maximum convenience to the trader. They can be just information panels, methodically, uniting results of several indicators, but they can issue the mathematical result of the general calculation.
First of all, complex Forex indicators shall:
- to execute fast and exact calculation and to display correct information for the analysis;
- to give the obvious and unambiguous trading signals which aren't allowing a double treatment;
- to be universal (signals shall be identical to signals of similar indicators) and not to lose accuracy upon changing time frame or a trade asset;
- signals of the indicators which are included in the package shall confirm to each other;
- to contain a possibility of the fine adjustment of parameters, and optimum − to give access to a program code.
The situation when the majority of the techniques used in it show an identical signal or estimate the probability of some direction from 70% and above will be an optimum signal of any complex indicator.
You can use the following in the mechanism of calculation of complex indicators:
- the usual combination of algorithms of calculation of several indicators;
- the option when one of them is calculated on the basis of data of another one − the method doesn't require skills of programming, but also opportunities for the creation of indicators are limited;
- specially written program code with the use of an algorithm of calculation of two and more different indicators.
We offer several options of complex indicators which can be found in open access and which was practically used.
Trend complex Forex indicators
In the course of determination of parameters of a trend the main task of such complex indicator − to reduce delay because of calculations for history. The second purpose is to clean speculative throws and to issue recommendations the closest for average movement with the help of the filters. Both pulse techniques as well as regular calculations of an average can be used as filters.
All trend techniques are divided into those which:
- compare current price with max/min for the last period and create volatility channels;
- calculate indicators data on some algorithm and carry out dynamic graphical creations;
- calculate buyers/sellers balance of the trade volume analysis (or price ticks).
From the practice: it isn't recommended to set up multiple period values and multiple shift values in relation to the current price when using the calculation of several moving averages (especially common type) in the complex indicator.
Examples:
Ichimoku Kinko Hyo
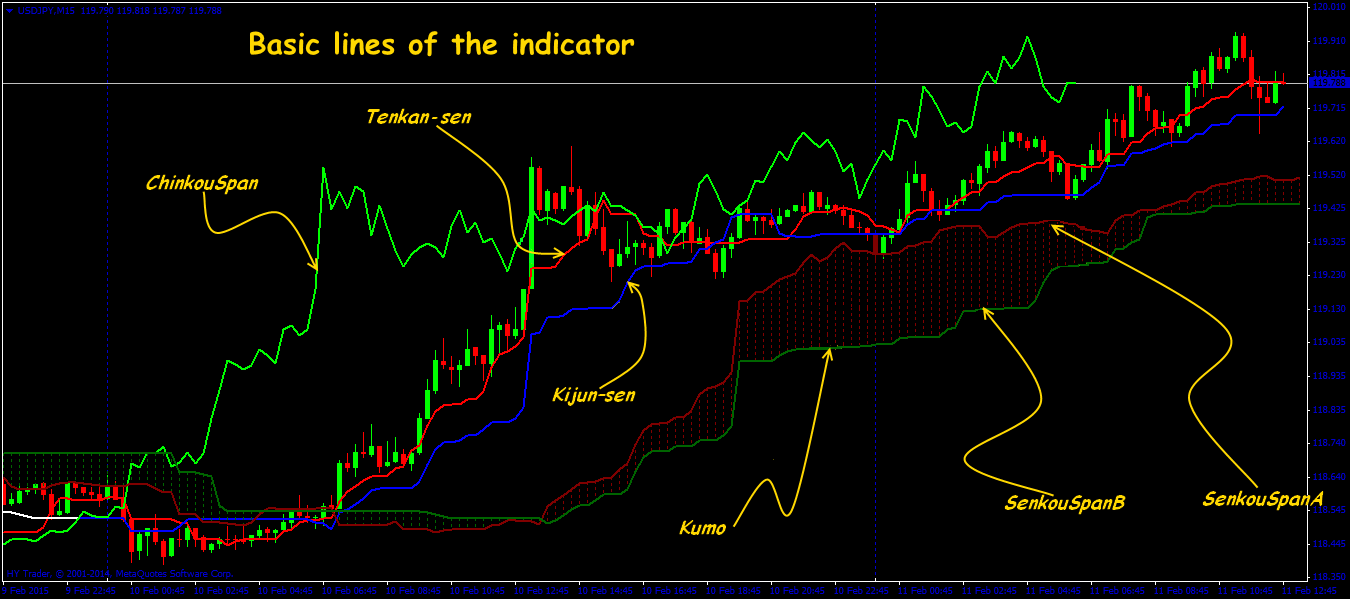
The unique complex Forex indicator − well-known Ichimoku is included into all standard platforms. Only one tool shows a medium-term and short-term trend, the price range and points of changing direction, builds dynamic levels of support/resistance, gives a set of signals on an entrance with different degree of reliability. Its popularity is based on the optimum matching of calculation parameters, and actually, these are the simple averages sliding with a different shift in relation to the current price.
MAChannel_close

The representative of interesting trend channels which included non-standard calculation procedures. Borders are the price channel according to historical data between points of intersection of several moving averages, more precisely – between two consecutive (nearby) − the so-called «trend channel of averages».
Those who accustomed to use versions of the PSAR indicator see in its points of the change of construction the analogy to points of «break» of the points line when changing a trend. The indicator doesn't give trading signals, but it surely identifies a medium-term trend and approach of a turn. This indicator solves a problem of diagnostics of a long flat much better, than using combinations of moving averages.
If there is the first crossing of fast moving average by slow below up on some price interval, and the following – in the opposite direction from top to down, then such site is meant by a part of a bull trend. The maximum price on this interval determines the upper bound of our channel. Similarly – for movement down. The minimum price on this site will determine the lower bound.
Power Fuse indicator
The interesting combination of standard indicators BollingerBands+MACD steadily works at any asset and a time frame.
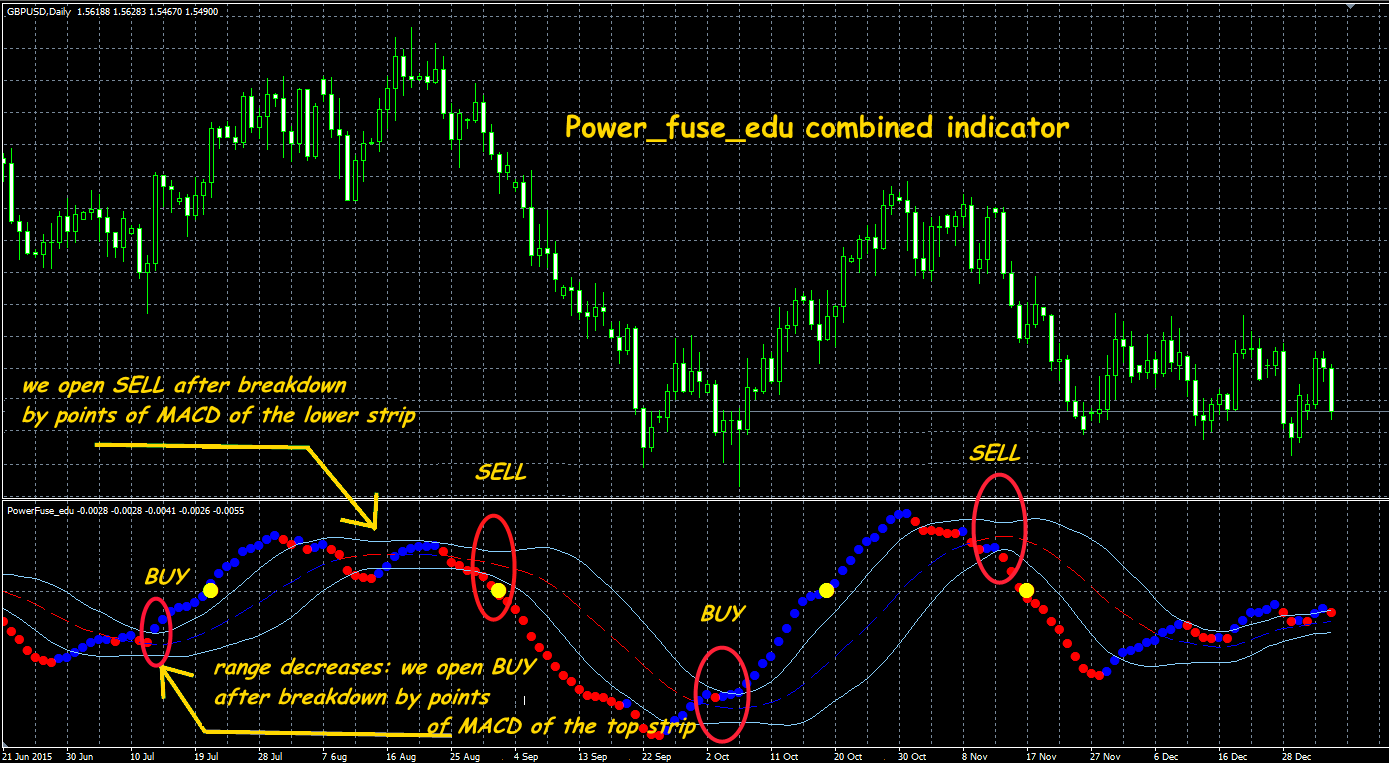
The indicator is located in an additional window: the line from blue, red and yellow circles is MACD, and two other lines of blue color – Bollinger`s strips. Red points mean that MACD falls, blue − grows, yellow points appear when MACD crossing a zero mark. strips look and behave in Power Fuse as usual.
The main idea – to find a trend momentum (new or old) after consolidation and, respectively, receipt of a signal on a potential entrance to the market. We wait for narrowing of Bollinger`s strips, and then we enter the market after a breakthrough one of the strips by MACD points. If MACD breaks the lower celestial blue color strip after narrowing − we sell, if upper − we buy.
In practice the most reliable options are:
- an entrance to the transaction when crossing MACD lines of the Bollinger's channel;
- trade at the formation time of a narrow horizontal corridor of the Bollinger's channel – an entrance in the direction of BollingerBands breakthrough.
It is necessary for purchases that MACD crossed the top line of BollingerBands channel in the direction from belowup, for sales − rules are opposite. In the first case, the transactions are late − by this moment the most part of the strong movement is already exhausted.
According to the second option using indicator, except the formation of the narrow channel, both of its lines should not have a pronounced inclination. The price accumulates forces for the subsequent breakthrough and MACD exit out of borders of the channel will report about the beginning of this throw.
Target points and levels of stops are determined by usual levels of support/resistance.
Azzx EMA Volume indicator
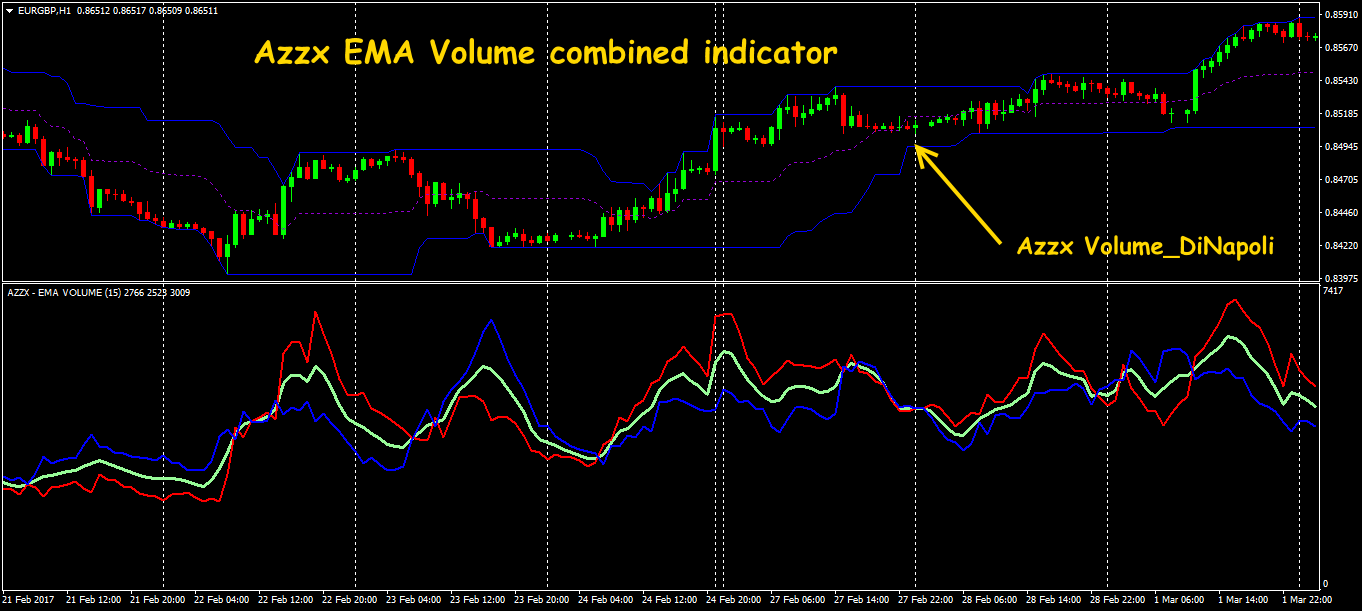
The indicator is based on a method of decomposition of tick volume on that one which has entailed the ascending trend and on that one which became the reason of the descending movement. It is located in an additional window and consists of three lines with the only setting – the calculation period.
The green line symbolizes tick volume and if this line grows, then it increases, in case of decreasing the line – falls; the blue color line speaks about the descending tendency, and the red color line − about ascending.
That line which moves above the main one at present shows the strongest market direction at the moment, and it allows to estimate whether the trend proceeds or shall preparing for a turn.
Oscillators
They estimate the probability of a turn or continuation of a trend, show a deviation of current price from some average parameter. In general, the behaviour in critical overbought/oversold zones is analyzed, a breakthrough of the central line has a smaller value. Actually, the oscillator won't show the direction of a trend, therefore, it is actively combined with trend calculation procedures. Possible change of a trend is traditionally allocated to color or graphic elements.
Unique hybrid tools of the analysis are Chaykin's indicators, for example, the oscillator that represents a difference of moving averages from the 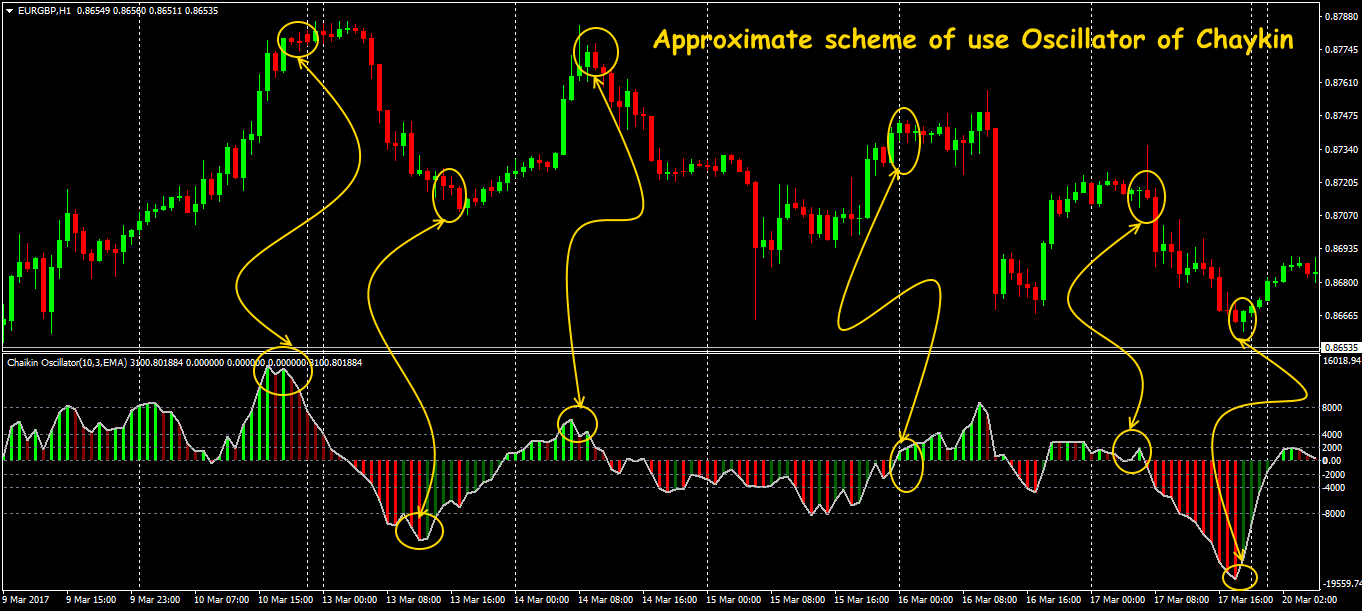
Value of the indicator calculates as a difference between EMA(3) and EMA (10) from Accumulation/Distribution values. Chaikin Oscillator creates two main types of signals – crossings of the central line and divergence. Practically all classical signals of MACD are also applicable also to Chaykin's Oscillator, but it is always necessary to remember that all these signals concern Accumulation/Distribution, but not the price of the most trade asset. It causes additional delay.
Trade is carried out on the strategy similar to standard MACD: the strongest signal is crossing of zero level, weaker - turns in critical zones. The further there is a turn point from the zero line, the trade signal of the indicator of Chaykin is stronger.
If the current price long enough is above the average range of the prices, so buyers carried out consolidation of the positions and the cost of a financial asset grew. The closing price is closer to a maximum of trade range, the warrants for purchase are saved up more.
To the contrary, if the price is below the average range of the prices, then at present investors are engaged in distribution of the assets, that is − sales. And the price of closing of a financial asset is closer to a minimum of trade range, the this asset is on sale stronger.
RSX nrp coronforex combined indicator
The oscillator without overdrawing – trading signal in case of changing color

In practice, the advancing properties of indicators of this type are too exaggerated. Oscillators lines too nervously react to the active change in price, and during speculative throws they can't be used at all. Using of several techniques with different parameters allows to increase the accuracy of overbought/oversold signals, to clean a traditionally large number of false signals and to see possible situations of a divergence in time. Selection of parameters has to be very careful, it`s the best of all – according to each trade assets separately.
Examples:
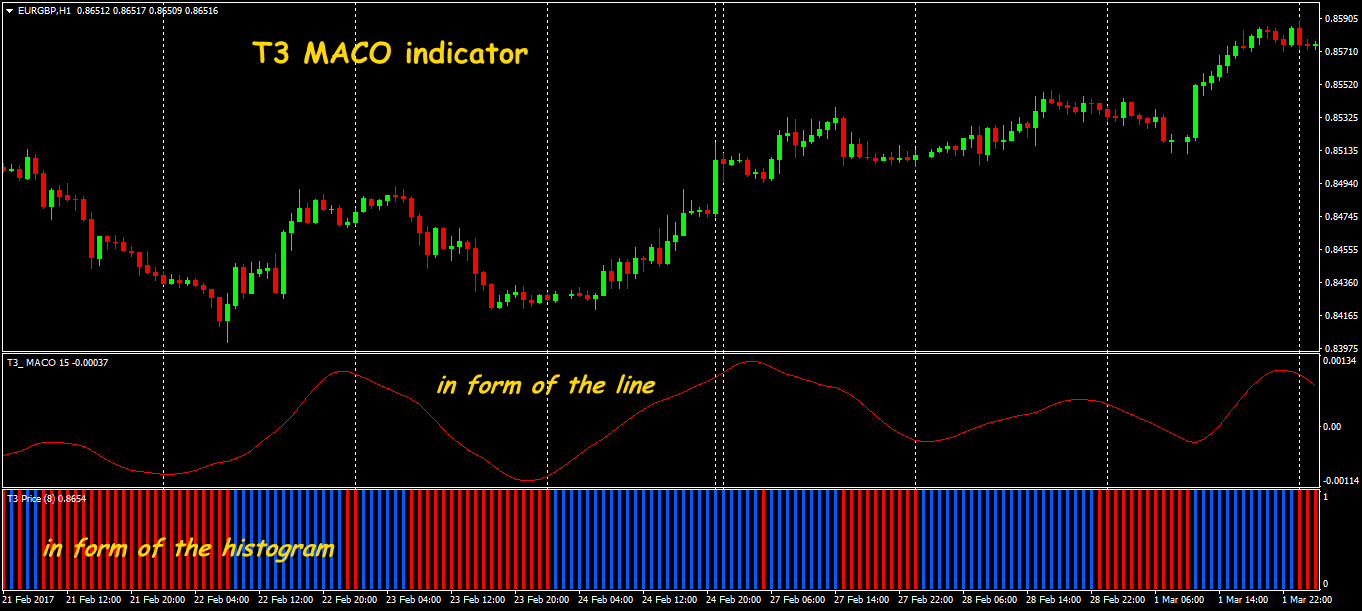
T3 MACO indicator
The modified MACD plots not the customary histogram, but the line similar to moving average based on data of the standard indicator in an additional window. The T3 MACO indicator`s line moves around the zero line, has tuning properties, standard for MACD, but at the same time has also a row of additional functions. The main tuning property of the complex indicator is b multiplier:
- in case of reduction of the parameter the indicator line becomes rounded, without sharp throws with a small amplitude;
- in case of increase in parameter, the T3 MACO line changes the principle of movement – there are sharp thorns and the number of intersections of the central line increases.
Trade signals are treated as in the ordinary oscillator: turns in overbought/oversold zones and behavior in the field of the central line.
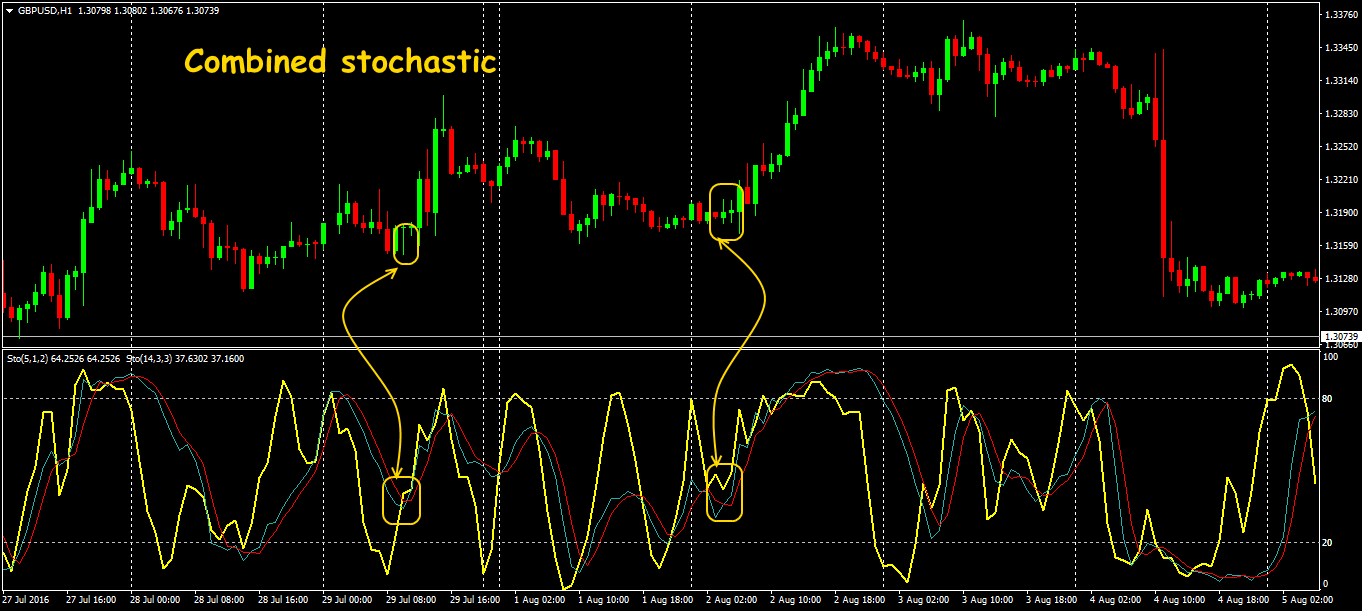
The combined Stochastic
Sets of the same type indicators, such as the combined oscillators which work with data by identical methods, but, for example, from different timeframes, look rather reliable.
We have: the main line − with parameters %K=14, %D=3, delay =3, the LWMA method, Close/Close prices, and additional − (5; 1; 2; EMA; Close/Close). In an indicator window from above and from below, there is a 2% gap for an assessment of the lines behavior on a contact of values of 0% and 100% zones.
The behavior of a standard stochastic on different timeframes is analyzed: main line − long-term, additional − short-term traders moods. Preliminary entry points are formed on the ends of kickback, that is in places of a possible refilling towards the current trend. It is used on H4, H1, M30. On speculation – it isn't recommended (too lies!).
Bollinger Squeeze indicator
A set of oscillators with different calculation procedures is more accurate. This Squeeze tool includes information on five indicators: Stochastic (14; 3; 3), CCI (50), RSI(10), MACD(5; 34; 5), Momentum(14) which output switches by the trigger Type variable in input parameters. All parameters can be (and even shall be!) changed according to specific trade system. Trade signals on the timeframes from H1 above almost don't delay.

Hybrid analysis
The complex Forex indicators are also included the hybrid tools when the additional indicator is constructed on data of standard calculation, for example, moving average to the oscillator histogram or StochasticRSI. In the latter case it is possible to get rid of shortcomings as much as possible: the sharp reaction of Stochastic even on insignificant price impulses and «sticking» of RSI about the extreme levels at a strong trend.
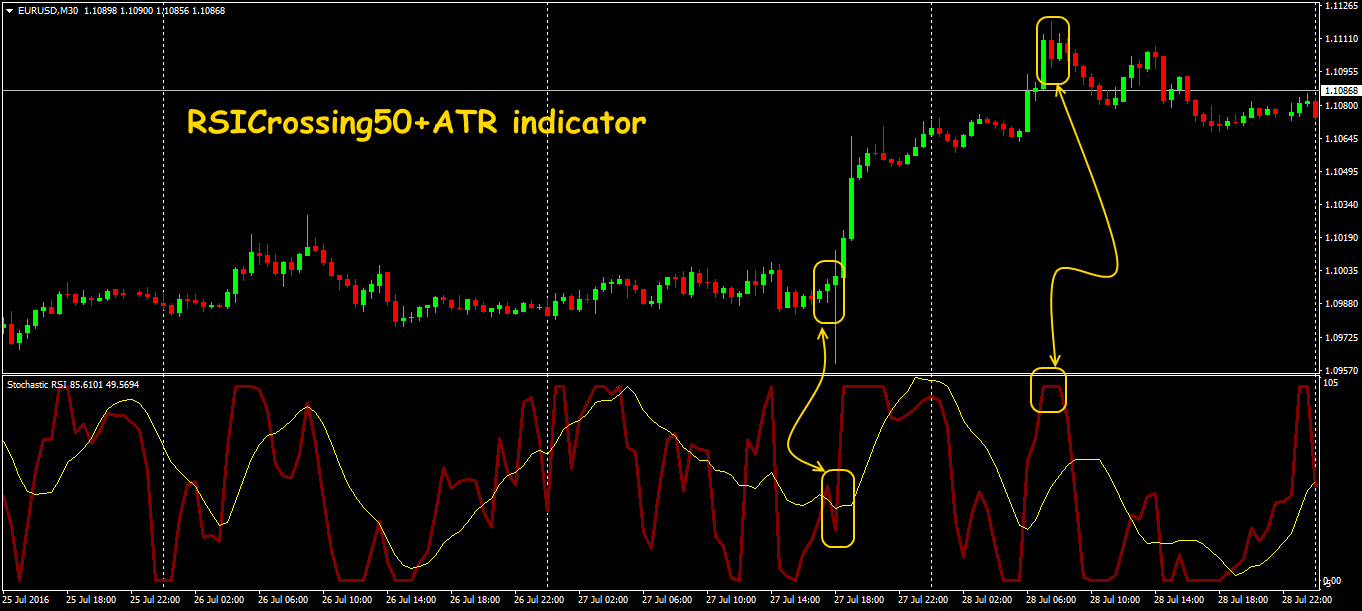
RSICrossing50+ATR indicator
Fans of binary options speak well of this indicator − it can be considered an example of the successful volatility analysis. A crossing of level 50 by the RSI line is a trade signal, the indicator draws a blue arrow for an entrance to BUY and a red one to SELL in an entry point. Shortcoming: standard delay, therefore, options with expiration term not less than 1 hour are recommended.
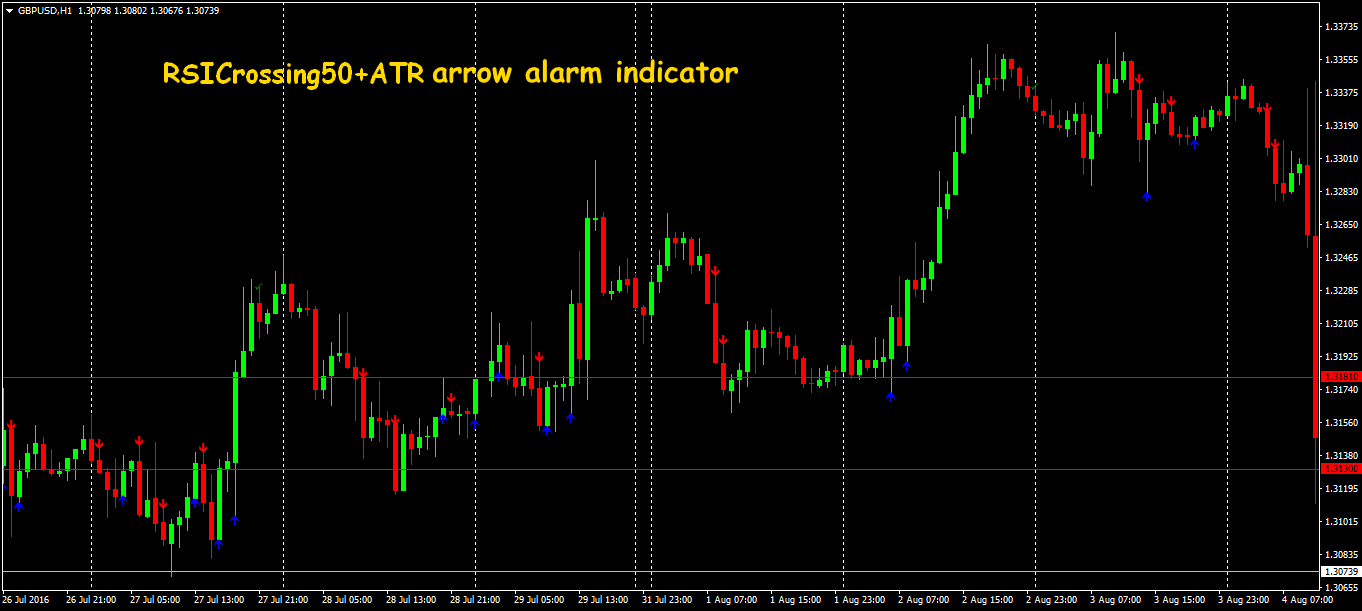
One more version of the indicator (signals in the form of arrows):
Information indicators
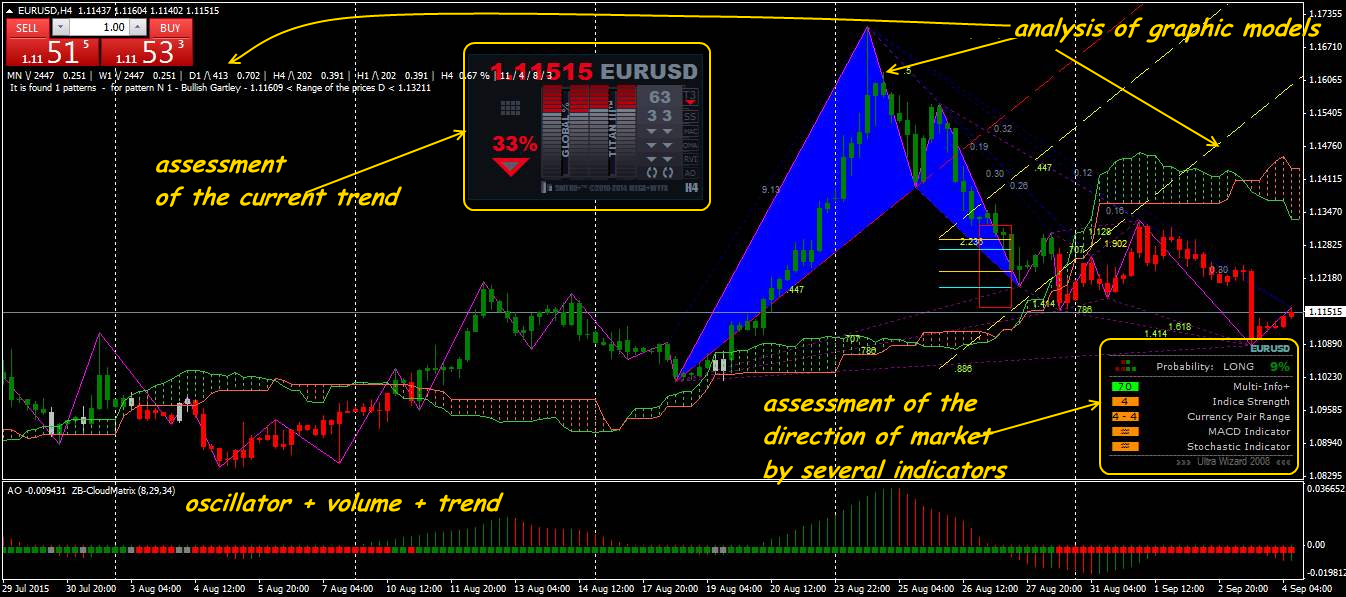
This type tools (orders, time, a trade candle, trading sessions, results of trade indicators) visualize the settlement and any other information in the form of helpful data. Graphic, test, digital results are allocated on the screen freely, are highlighted, give sound signals and contain other usefulness. As a result, a lot of necessary (the truth, most often, – superfluous!) information is systematized in a view comfortable for the trader perception, only indicators final settlement data are displayed.
Information monsters, such as PerpetualProfitSoftware or iPanel can be used as global financial settlement center as they display urgent data of a set of standard indicators, the directions and time frames and even give the trade recommendations.
PerpetualProfitSoftware contains the analysis of everything that can be useful: three MovingAverage, MACD, RSI, CCI, ADX, Stochastic, Momentum, RVI, FOR, BULL/BEAR, ATR. Besides: UP (down): DN (up): OS (oversold), OB (overbought), CS (crossing) of SW (flat) on the M1, M5, M15, M30, H1, H4, D1, W1 time frames.
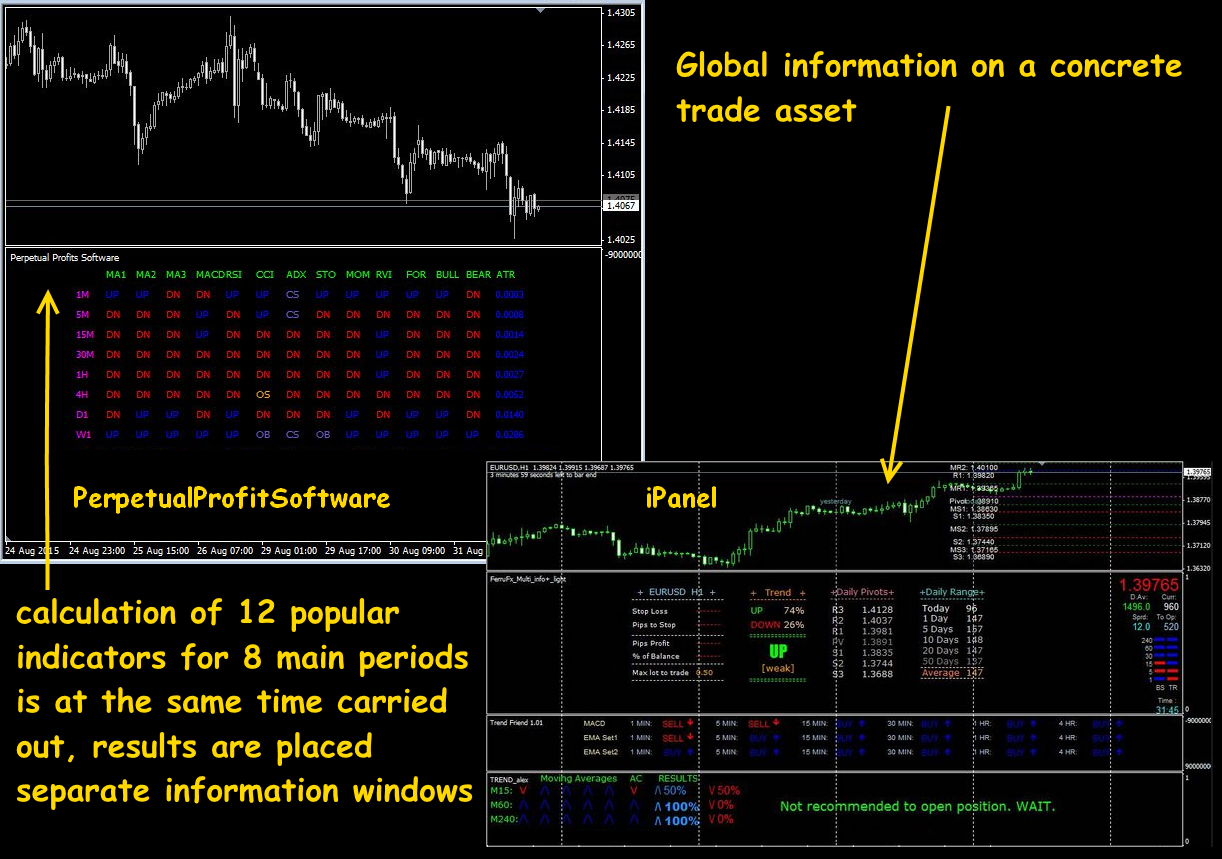
Data in the horizontal direction − a trend status on a certain time frame. Data in a vertical direction – price dynamics on various periods.
The shortcoming is the set of extra data distracts and disorients, besides, can encumber the screen. In the majority of indicator versions, the information is displayed only on one asset, is slowly updated and uses technical resources.
It`s difficult to use such abundance of information, but each parameter can be disconnected in settings. The choice of optimum structure of information depends on the trader`s professionalism and indicator setup possibilities.
Extreme options
Sometimes in the network, you can meet the complex Forex indicators which sense «is rather deeply dug». As a result of such experiments, the advantage of each component is lost and everything that is possible though approximately to consider a trade signal, has too low reliability. For example, attempts to apply graphic patterns on oscillator data:
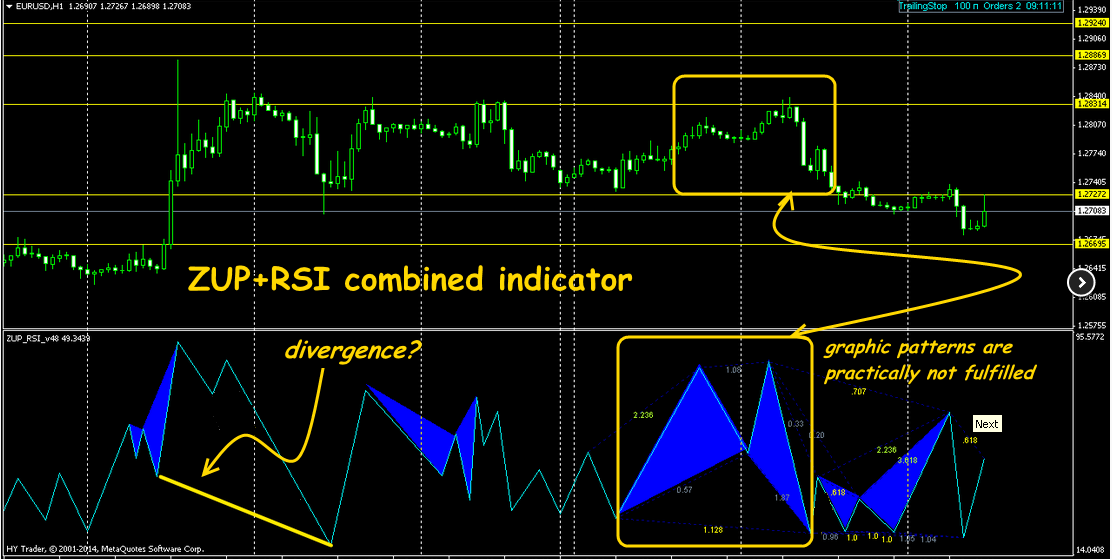
Among the indicators borrowed in the stock market, we can note the Brooky Rsi Ichimoku indicator – such «filter on the filter» combining sensitivity of RSI and the global analysis Ichimoku. Data for construction – not usual price, but settlement data of the oscillator. This complex indicator «unloads» the main chart and builds all lines in an additional window. The RSI line (green) considerably increases the sensitivity of the indicator on the small periods.

We don't forget: the market constantly changes and complex Forex indicators first of all «suffer» from the financial assets change dynamics, and therefore demand for the constant parameters adjustment according to new conditions. The more difficult indicators in a set, the more often you have to correct.
Case study: the Power_fuse_edu indicator combining the modified MACD (in the form of points) and the dynamic channel (Bollingers` strips option). The indicator rather reliably worked last year at such difficult asset as pound/dollar, it was absolutely unsuitable and steadily gave false signals on speculative dynamics of 2016.
And as the conclusion …
As they say, too difficult – the enemy for good, at the same time the successful traders trading on the blank chart meets seldom. The example given below looks overloaded, but, nevertheless, it`s rather conveniently to work on such system.
Complex Forex indicators, for sure, if they are correctly adjusted, will help to read the market, will prompt the moment for an entrance and an exit from the transaction and will react to changes in time. For convenience, they are traditionally displayed on the additional screen that didn't prevent support of transactions.
We don't forget: in the non-standard market (the thin auction, news, speculation) all indicators shortcomings entering complex calculation are surely shown and moreover − amplify. You should use such trade signals only after full testing.
Modeling the non-standard indicator, you should take into account that from the point of view of mathematics it`s much more easy to compensate delay, than to clean an incorrect signal on an advancing. The majority of popular indicators can be found in open access – don't be lazy to penetrate into the calculation procedure put in them, to study the programming bases and to adjust the indicator for yourself. Any indicator is only recommendations and the trader should decide how they are reliable.
Social button for Joomla