

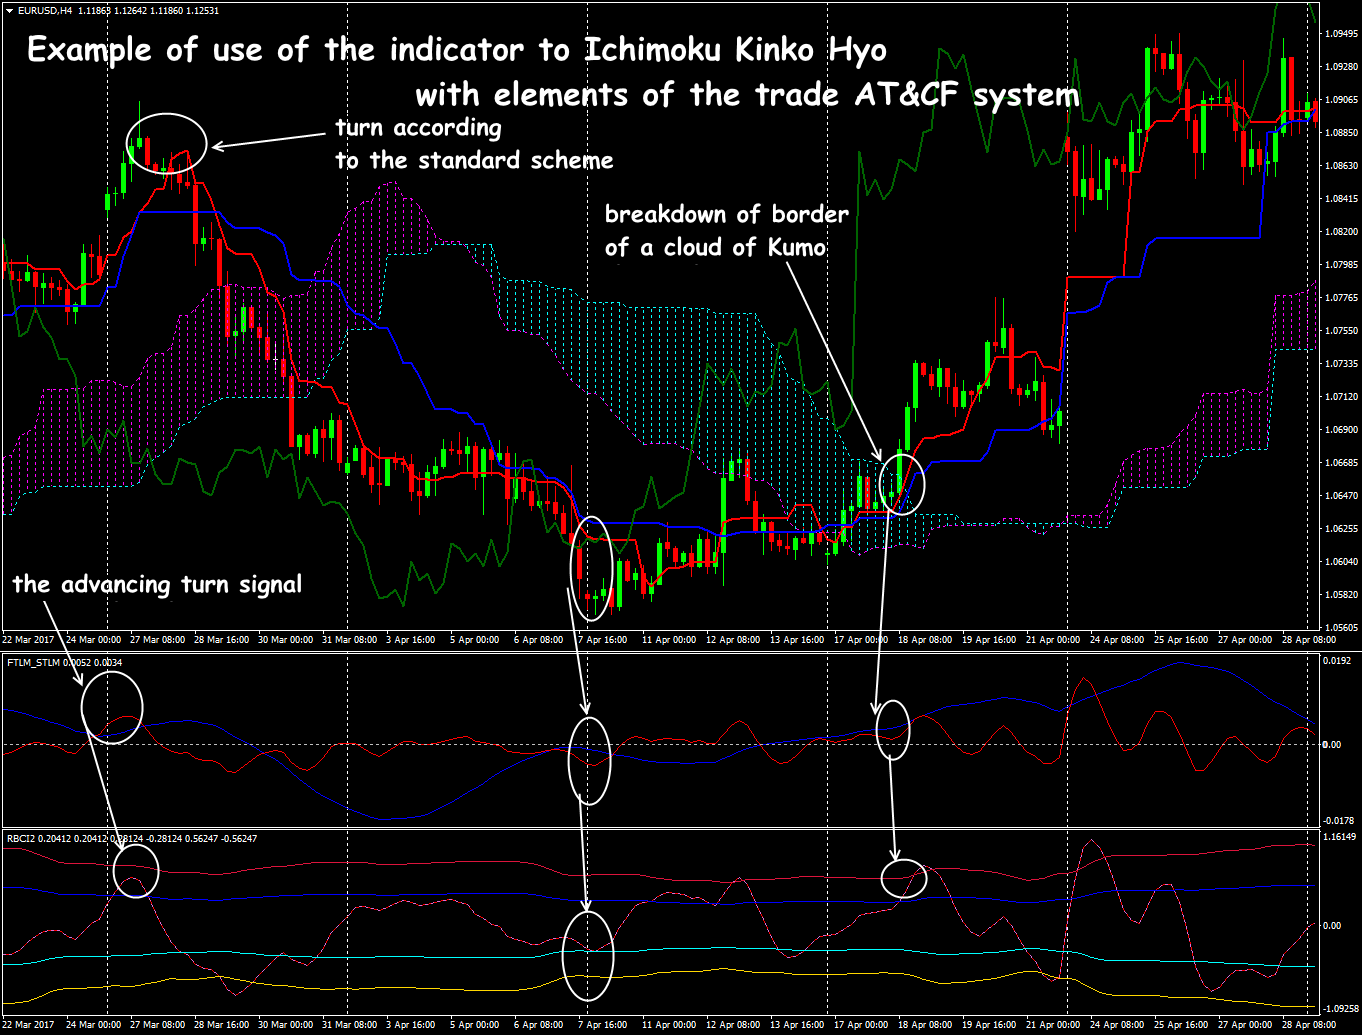
")
AT&CF system authors just wanted to draw the attention of programmers and technical analysts to the application of digital methods, and even didn't expect, how convenient to use Forex adaptive indicators for the analysis of the financial markets. We will try to understand how it can be used in real trade.
Dynamics of exchange prices from the mathematical point of view is described by not analytical function – its schedule can be smooth or broken, continuous or with gaps. Fourier's theory is the base of the market spectral analysis and its time row. According to Fourier, any such function on a final time interval can be presented by the infinite sum of sinusoidal functions which are called their frequency ranges.
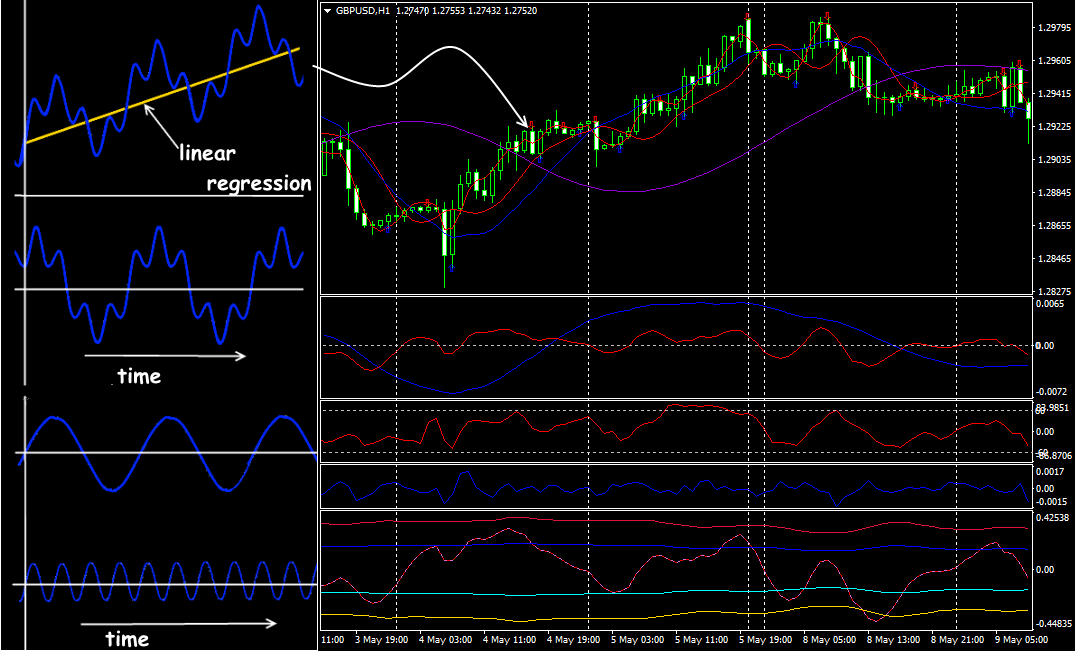
It is supposed that any dynamic curve can be simulated near a sinusoid with sufficient extent of approach. The Forex adaptive indicators developed on this base break a flow of price data into sinusoids with different parameters of cycles which, in fact, reflect cyclic fundamental and technical dependences in the financial market.
In other words, the spectral analysis of the financial and trade markets are software applications from the theory of signals which are applied in digital trade systems. It is considered that there are no analogs these tools, but their methods of an interpretation of results are similar to standard Forex indicators and fans of the technical analysis apply them in real trade for a long time.
Basic concepts
We won't load the reader with excess mathematical details, we will tell only that searches of the technologies put in Forex adaptive indicators are caused by the fact that all technical tools use historical data for calculation. And, as a rule, after repeated averaging, correction on volume and the other «improvements» which are catastrophically reducing the accuracy of trade signals. Nevertheless, price quotations represent the usual statistical array and if a price signal to carry out through Fourier's transformation, then it is possible to estimate «frequency» of the market and duration of fluctuations. On the probability of to what cycle the current fluctuations belong, it is possible to estimate a cycle phase (market type: bull, bear or flat) and to make the trade decision.
Of course, the price moment calculated by means of this method never coincides real «up to one minute», but the moment of the termination of the current tendency can be defined unambiguously.
How can it be put into practice?
From the point of view of Fourier theory price ranges on day diagrams can be divided into several spectral bands:
- low frequency: according to Fourier it is the range of frequencies from 0 to 4, from the point of view of the price − long-term trends more than 60 days;
- mid frequency: range of frequencies from 5 to 40, medium-term and short-term cycles (impulse correction) − 10-60 days;
- high-frequency: the range of frequencies from 41 to 130, from the point of view of the market − market noise which occupies the most part of trade time (range), the cycle period − less than 6 days.
The theoretical duration of the frequency range of Fourier – 130 periods, for the foreign exchange market usually take into consideration the value 120 or 24 trade weeks. In that case, a band of mid frequencies will cause the greatest interest − the period of 16 days, 16 cycles a year and peak 32 cyclic sine curves of the 8th day period. All remaining will be considered as market noise.
Numerous practical tests showed that methods of spectrum analysis show excellent results in the technical analysis of all types of the markets. For instance, frequency analysis application simplifies selection of a set of moving averages or parameters of oscillators, such as RSI, MACD, Stochastic – it allows to clean the rate of «low-frequency sections», uninteresting for the trade.
AT&CF system
The only trade system on Forex adaptive indicators available for a broad audience is the method of following a tendency and market cycles or AT&CF. The basic system is realized by authors in the MTC form which generates a set of trade signals, but in general, all its tools are quite applicable for manual trade. Developers have carried out a set of tests on various assets which, in general, have shown brilliant results − profitability at the level of 500-690% and a profit factor at the level of 15-17. But we will note at once – all available results of tests rather old (2000-2007), the markets became more speculative nowaday, it is impossible to ignore completely fundamental influence.
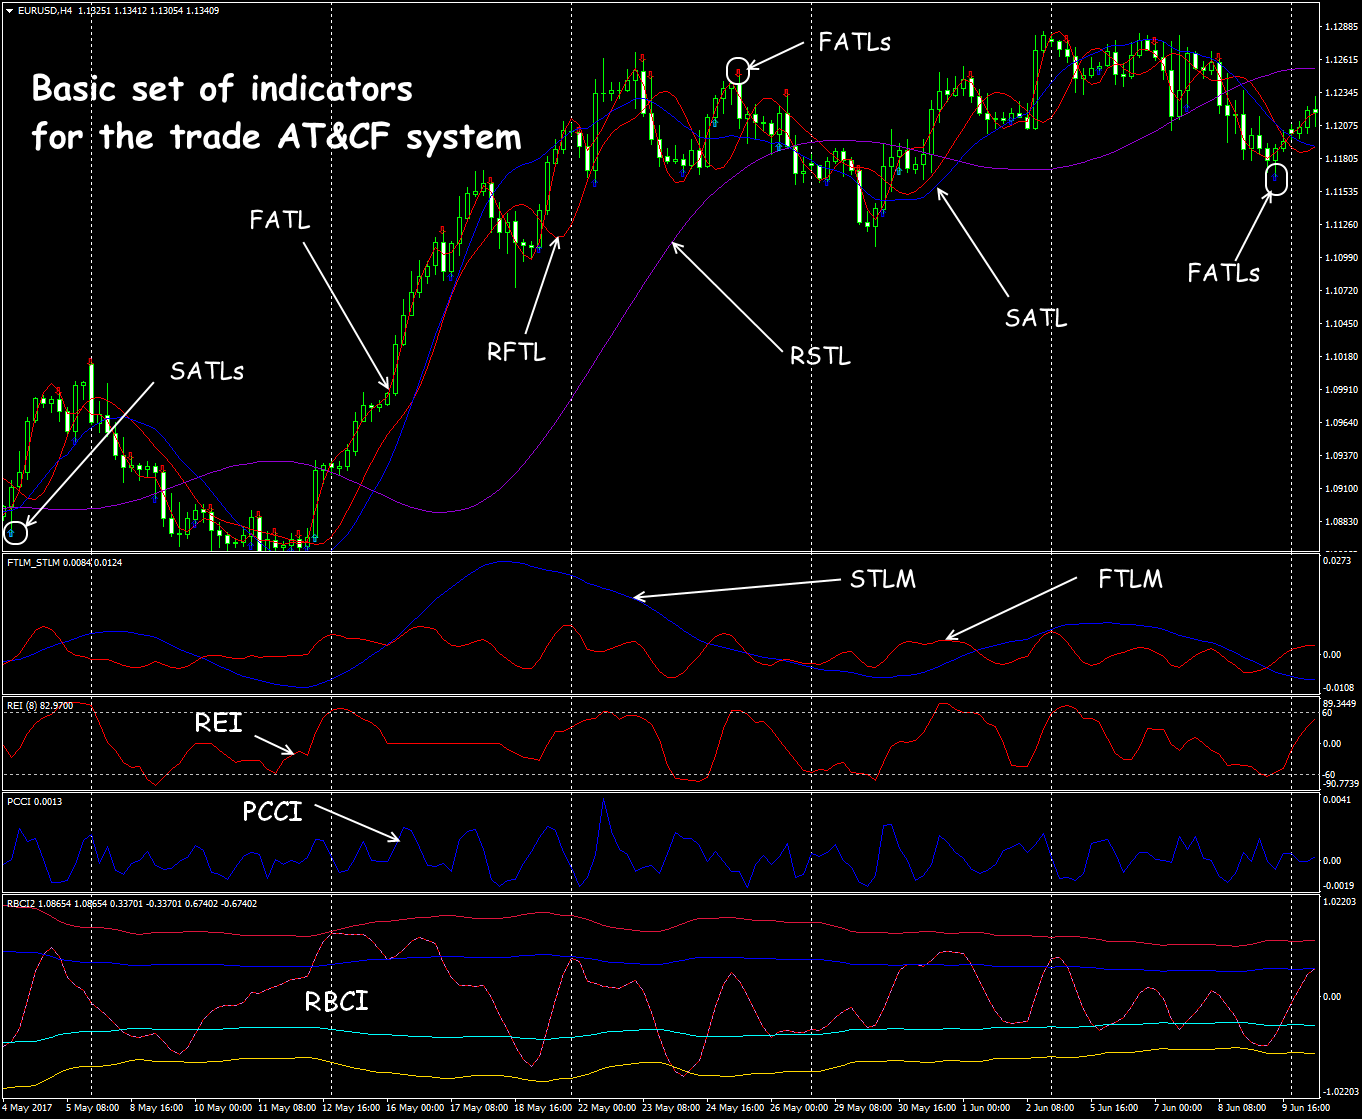
The trade system is the technical indicators for MT4(5) which are connected to the terminal in the usual way. The tools considered below are available in free access and are given for an example of the logic of the main trade signals.
Only the number of bars for calculation and colours schemes are usually available for settings. For thinner tuning, curious can rummage in a program code. The basic package includes:
Trend indicators:
- Two reference trend lines: RFTL (Reference Fast Trend Line) − «fast», RSTL (Reference Slow Trend Line) − «slow».
- FATL (Fast Adaptive Trend Line): an analog of fast moving average − the «fast» adaptive trend line calculated with use of the low-frequency digital filter;
- SATL (Slow Adaptive Trend Line): an analog of long moving average − the «slow» adaptive trend line for which it is used digital low frequency of the second order of the filter;
The FATL and SATL lines look the clearest - it is statistical estimates of lines of a short-term and long-term trend which, unlike traditional movings, have no phase delay of rather current prices:
- FATL (k) value is a mathematic expectation of the price Close (k), where k − number of the trade period;
- SATL (k) value is a mathematic expectation of FATL (k) for any k on the given time slot T.
Oscillators;
- RBCI (Range Bound Channel Index) − the channel index calculated on the basis of the bandpass filter;
The bandpass filter deletes the market «noise» formed by low-frequency components of a range (trend) and the speculative «noise» formed by high-frequency components of a range.
- the optimized index of commodity channel PCCI (Perfect Commodity Channel Index) – a rated component of an exchange rate fluctuations.
This analog of a CCI index reflects better a trade situation because instead of the sliding average uses a difference between the price of the closing of the period and its mathematic expectation.
- rates of change of the adaptive FTLM lines (Fast Trend Line Momentum) – for FATL and STLM (Slow Trend Line Momentum) – for SATL;
Analogs of classical Momentum – FTLM and STLM indicators show a rate of change (falling/growth) of FATL and SATL and calculated according to the same scheme, but use not the Close prices, but trend values smoothed as a result of a filtration. As a result, their lines turn out more smooth (without peaks and failures) and «regular» that increases forecast accuracy.
As a rule, the set is supplemented with the adaptive REI indicator – the oscillator (overbought / oversold of a market).
Basic trade principles
Use of Forex adaptive indicators and development of MTC on their basis assumes the following:
- business is running only according to the basic tendency determined by the SATL line («slow» adaptive);
- dynamics of the market is estimated on FTLM and STLM indicators − «fast» and «slow» trend features;
- the phase of the market is estimated according to the area (neutral, , local extrema) where the RBCI market cycles index is located;
- signals of oscillators are considered secondary if trend indicators show the strong, accurately expressed tendency;
- to consider signals of oscillators the main in cases when trend indicators signal about the lack of a pronounced tendency;
- the RBCI, PCCI indexes and values of the volatility of the «fast» adaptive line are applied to the StopLoss installation.
Main interpretations of adaptive indicators:
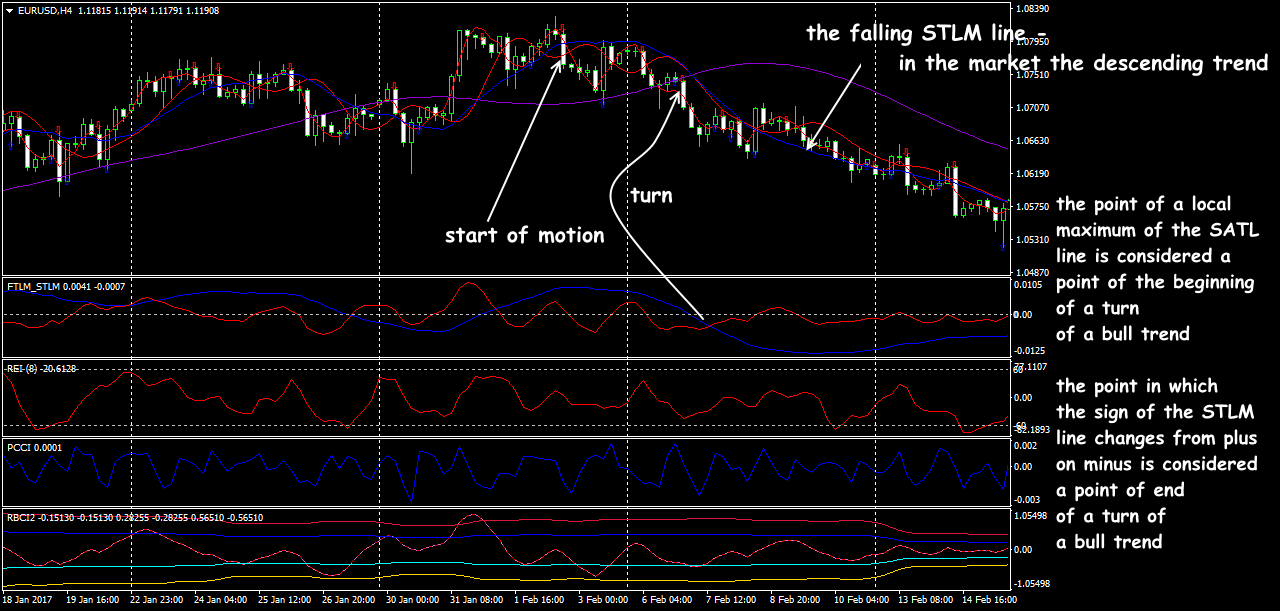
The direction of a trend is defined by the SATL line: grows –a bull trend in the market, falls – bear, the horizontal line – the market is neutral.

For determination of a turn the following scheme is used:

Interpretation of the advancing STLM indicator:
- positive value – a bull trend, negative – bear;
- STLM local extremum always precedes similar max/min on the SATL indicator;
- the emergence of max/min on the STLM line is a necessary condition for the formation of the top or a bottom on the SATL line;
For the ascending trend:
- if STLM and SATL grow together – the bull trend accelerates;
- horizontal, but positive STLM line at the growing SATL line – the stable ascending trend with an average speed;
- the more absolute value of the STLM indicator, the bigger potential at a bull trend.
For a bear trend we argue similarly:
- if STLM and SATL fall together – the falling of the price accelerates;
- horizontal, but negative STLM line at the growing SATL − the stable descending trend;
- the more absolute STLM value, the stronger will be a bear trend.

Coordination of signals with the FATL indicator:
- both of FATL (fast) and SATL (slow) trend lines together: grow – a strong bull trend, decrease – bear;
- the FATL line grows, the SATL line falls − bull correction on the descending trend or transition in a flat;
- the FATL line falls, the SATL line grows – bear correction on the ascending trend or consolidation;
- the beginning of active one-way traffic of the FATL and SATL lines at the same time – we wait for a turn (or completion of correction) and further the price has to move in the direction of SATL indicator line.

Interpretation of the adaptive indicator PCCI signals which shows price deviation degree from the mathematics expectation:
- if it more than , then we wait for the movement down (or at least, corrections), of course, in case of confirmation of a signal by other indicators;
- if the value of the indicator less than 1 – we wait for the similar movement up.
Anyway, the deviation from zero value has to draw the attention of the trader.
Main schemes of signals
The most widespread situation are brought, with author's marking. Conservative medium-term trade with low risk level is meant.
Signals in an initial phase of a trend (S6 and L6)
The beginning of a bear trend – a condition for the transaction for sale:
- SATL indicator line – already decreases;
- STLM indicator line – above zero yet.
- RBCI indicator – in an overbought zone (above 0.01).
We open the transaction at the price of the closing of the period preceding the emergence of a signal (or above).
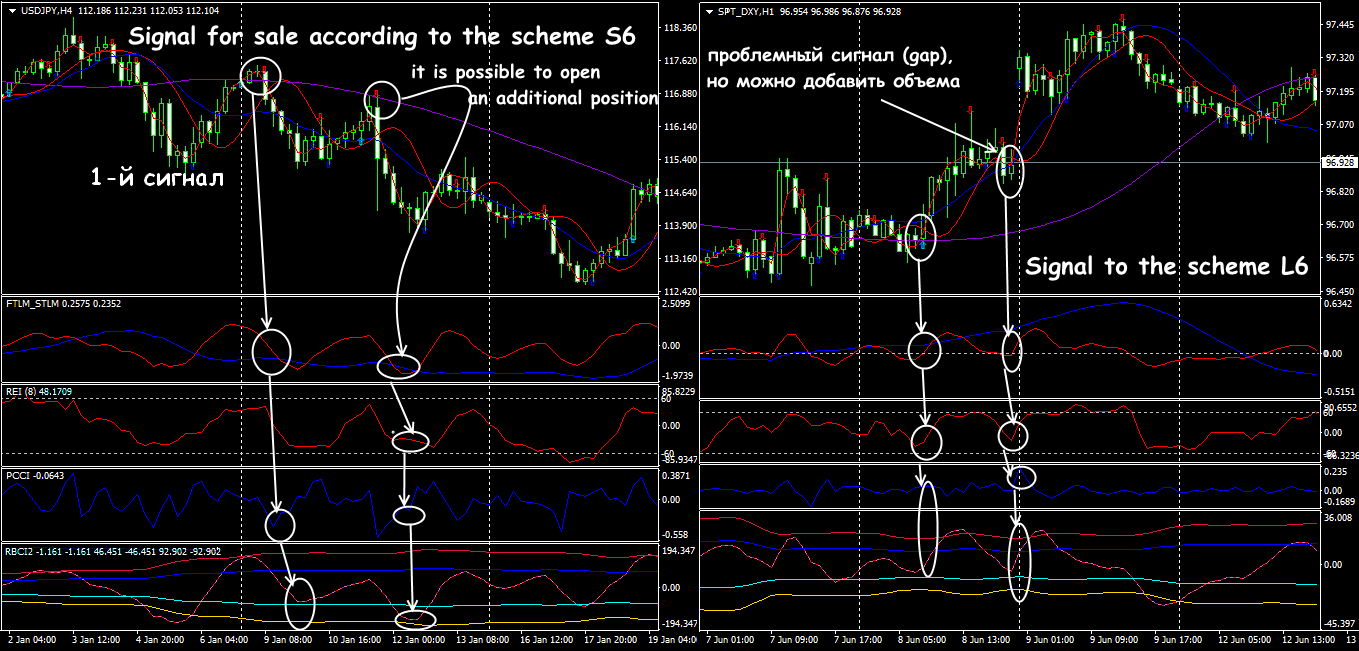
The beginning of a bull trend – a condition for the transaction on the purchase:
- SATL indicator line – already grows;
- STLM indicator line – below zero yet.
- RBCI indicator – in a zone of an oversold (lower than -0.01).
We open the transaction at the price of the closing of the period preceding the emergence of a signal (or below).
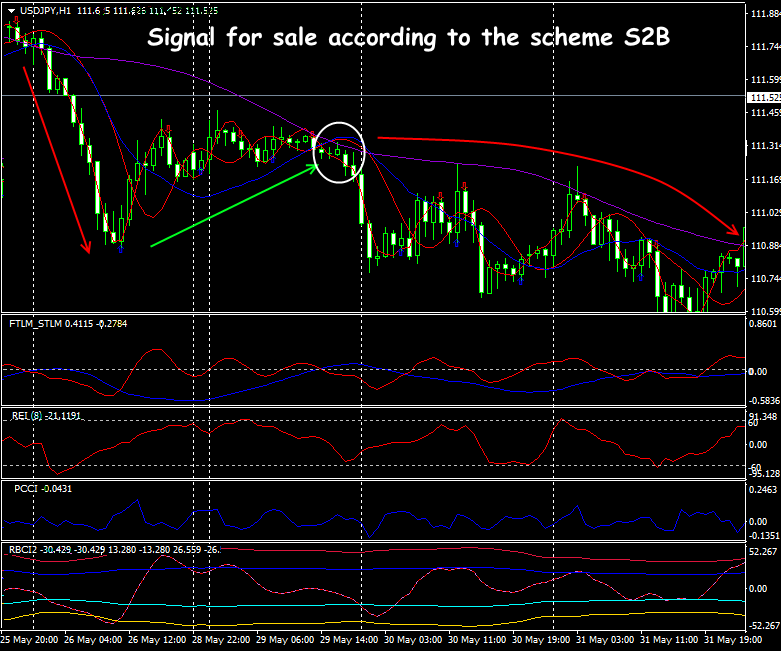
Signals on continuation of a trend after correction (S2A,S2B and L2A, LS2B)
For sales on a trend: S2A and S2B – signals of a continuation of a bear tendency after intermediate bull correction:
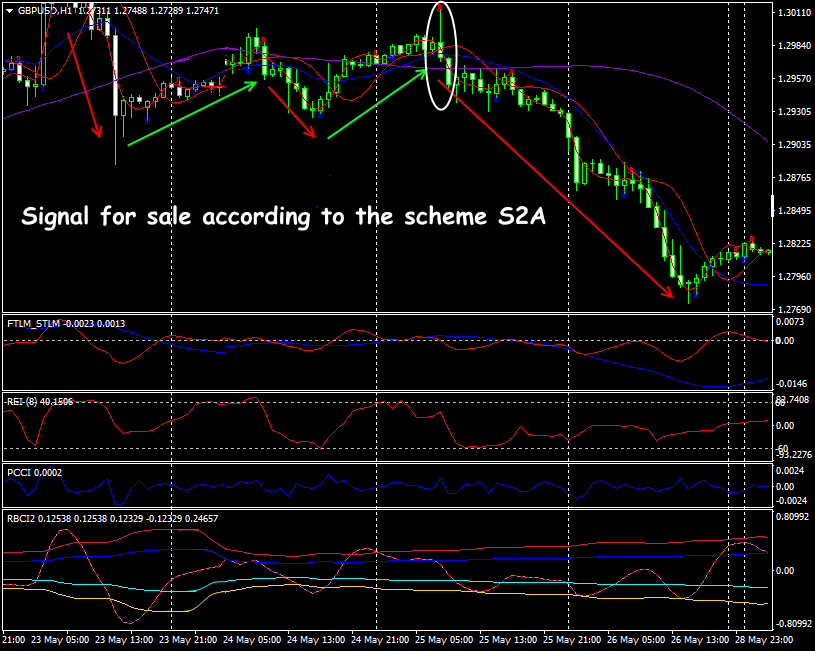
- the descending trend was created and gathered force (intersection from top to down of SATL and RSTL);
- synchronization of the movement of FATL, FTLM, RBCI indicators at the time of a signal;
- for the diagram S2A, the STLM indicator shall either fall or move horizontally;
- for the diagram S2B, the STLM indicator can grow, that specifies convergence of the SATL and RSTL lines.
- the absence of the resold PCCI market is necessary;
- the transaction for sale opens at the price of the of the next period or above.
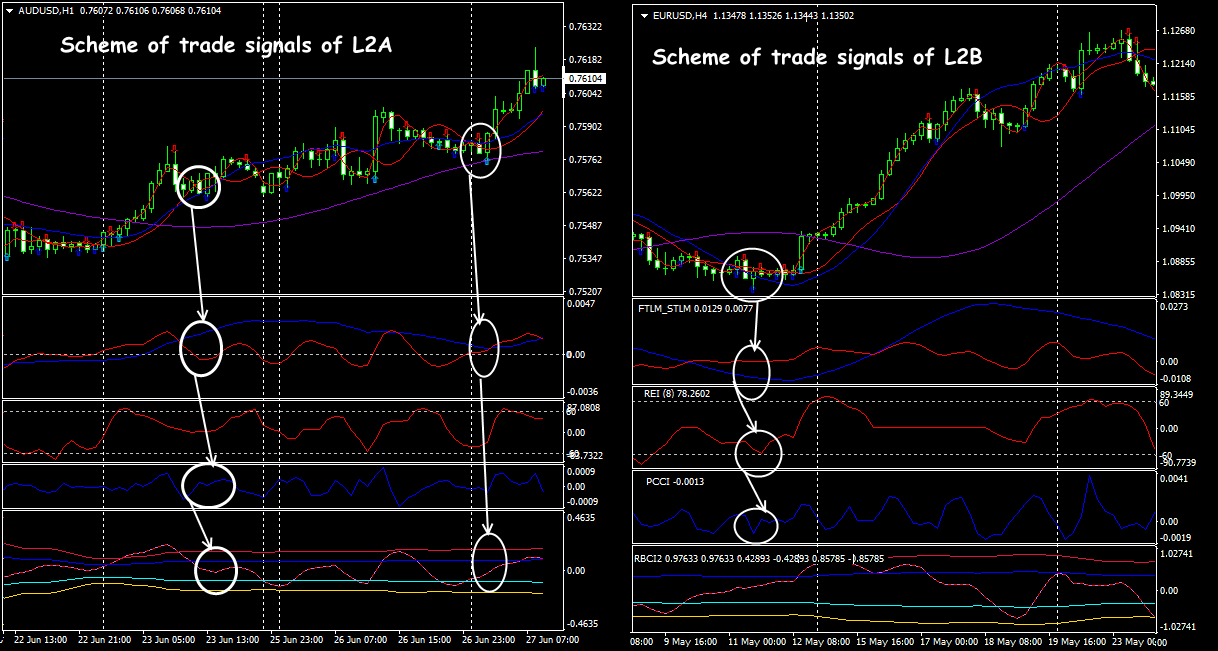
For purchase on a trend: signals of a continuation of a bull trend after bear correction.
- the ascending trend was created and gathered force (intersection from below up of SATL and RSTL);
- synchronization of the movement of FATL, FTLM, RBCI indicators at the time of a signal;
- for the diagram L2A, the STLM indicator shall either grow or move horizontally;
- for the diagram L2B, the STLM indicator shall fall (a convergence of the SATL and RST lines);
- there is no PCCI market ;
- the transaction on purchase opens at the price of the of the next period or below.
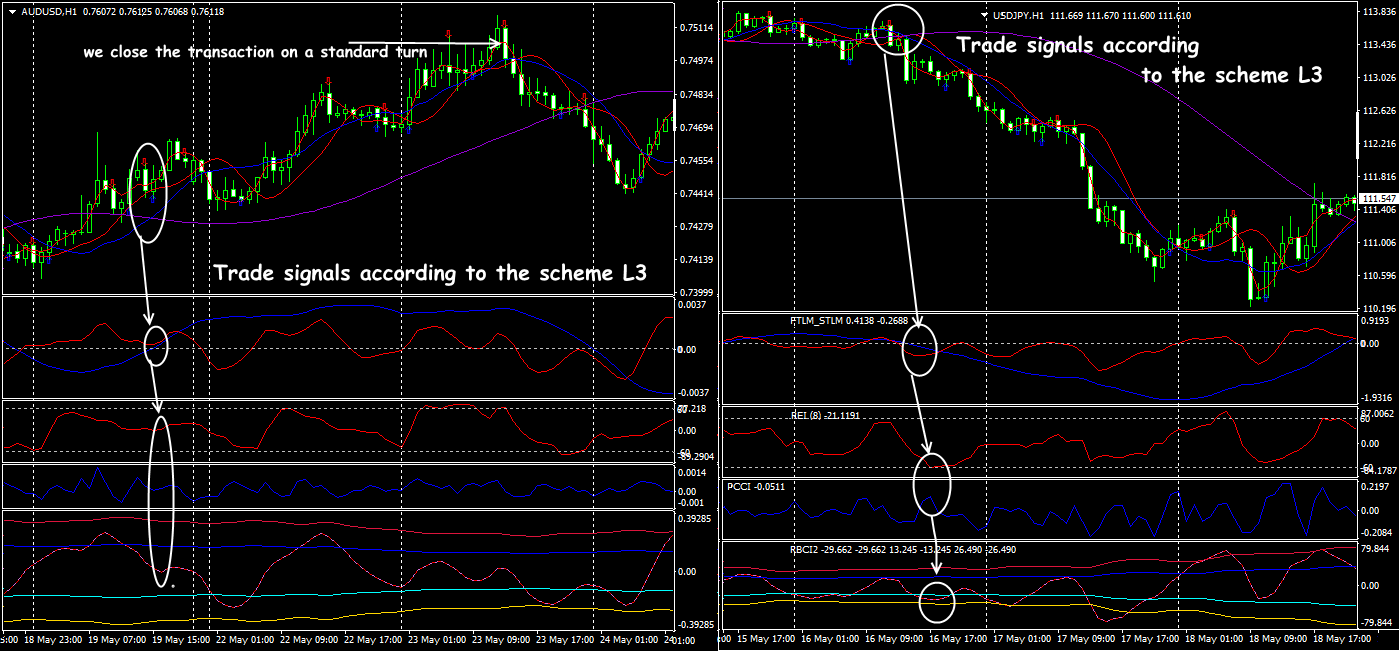
Strong signals of continuation of a trend (S3 and L3)
For the transaction for sale on the descending trend:
- STLM line moves below zero;
- FATL line was developed down;
- the transaction opens at the price of the of the previous period (or above).
The trade signal is generated if on medium-term (at least!) descending trend (or flat) − the SATL line is horizontal or sent down − PCCI forms local max in an overbought zone;
For the transaction on the purchase when the ascending trend:
- STLM line moves above zero;
- FATL line was developed up;
- the transaction opens at the price of the of the previous period (or below).
The trade signal is formed if on a medium-term bull trend (or at consolidation) − the SATL line is horizontal or sent up − PCCI forms local max in an oversold zone.
Signals of acceleration of a trend (S8 and L8)
Conditions for the transaction for sale:
Simultaneous breakthrough of the FATL indicator lines from top to down by the trend lines: «slow» SATL and «fast» RFTL.
The transaction opens at the Open price of the closed period or above.
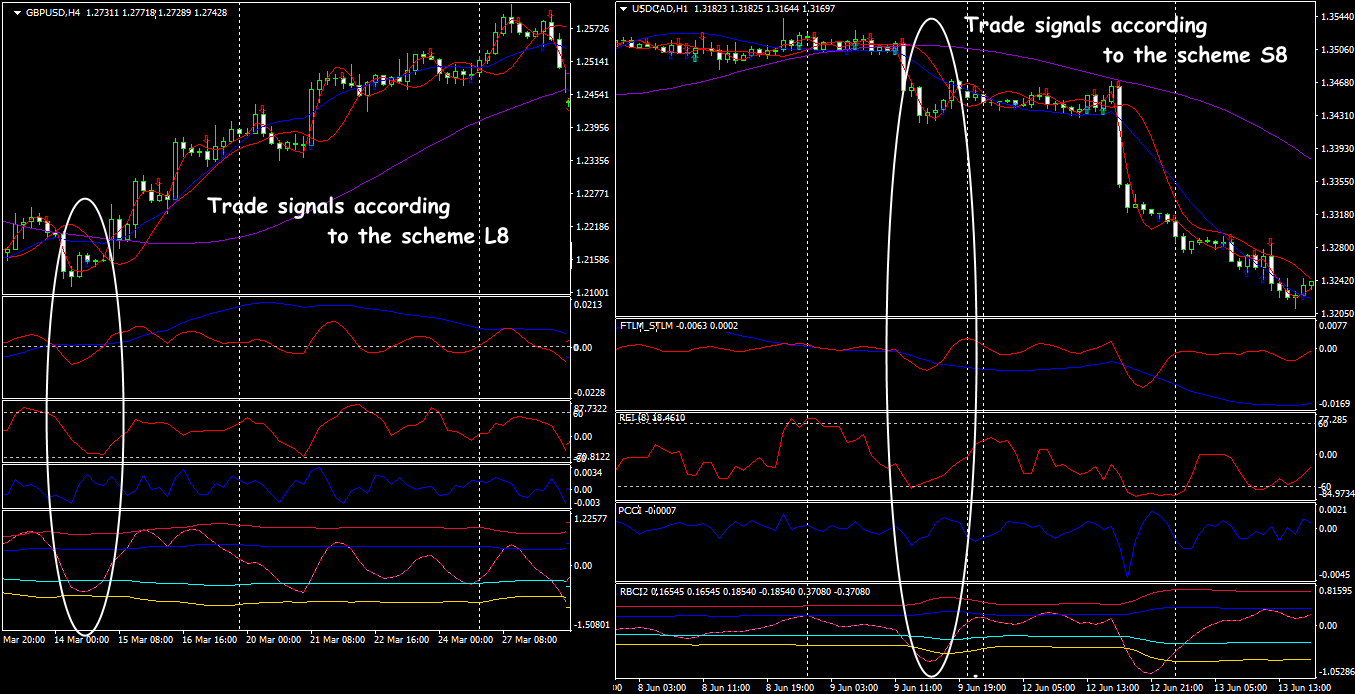
Conditions for the transaction on the purchase:
a similar breakthrough in the direction from below up
The transaction opens at the Open price of the closed period or below.
Signals on end of a trend (S5 and L5)
Signals of the last trend throw after correction after which the trend is developed.
For sales:
- SATL line goes down (a bear long-term trend), there is a crossing fact from top to down of the SATL and RSTL lines;
- RBCI and PCCI indicators in the overbought condition.
The transaction opens at the Close price of the previous period or above.
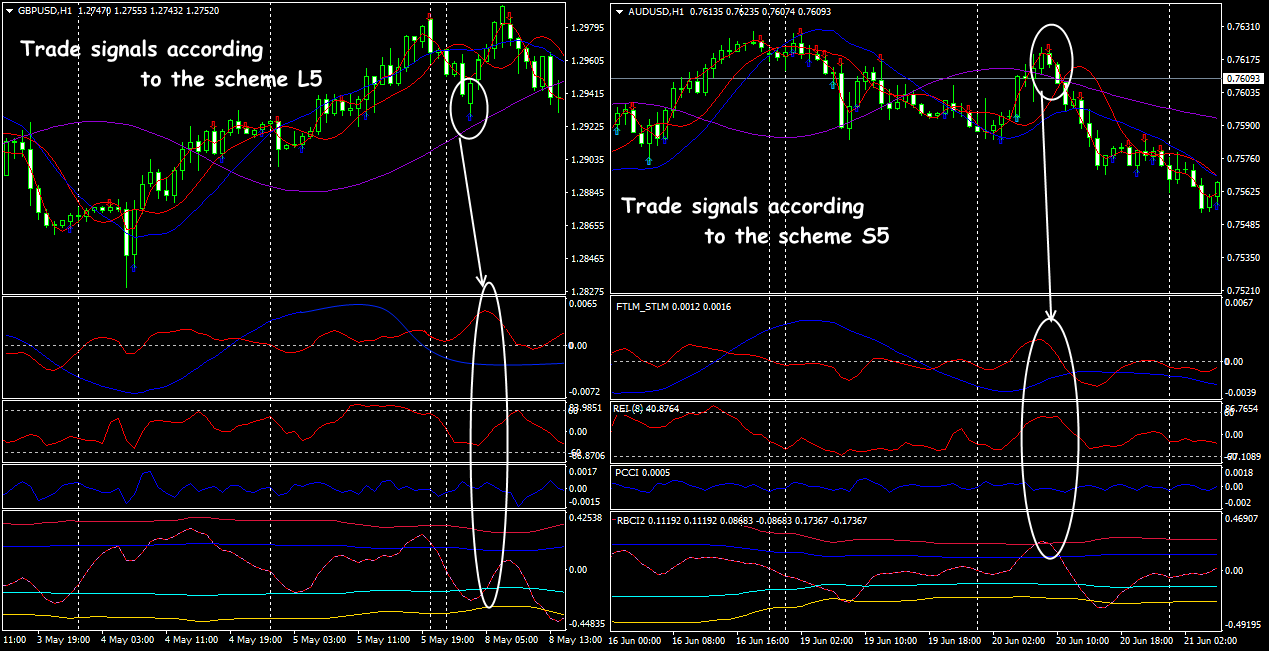
For purchases:
- SATL line goes up (a bull long-term trend) after crossing from below up of the SATL and RSTL lines;
- RBCI and PCCI indicators in the resold condition.
The transaction opens at the Close price of the previous period or below.
Standard signals of a turn (S1 and L1)
Conditions for the transaction on the purchase:
- the first bear corrections on the ascending trend;
- the growth of the price on the falling STLM;
- the converging of the SATL and RATL lines;
- we open the transaction at a turn of FTLM and RBCI down;
- StopLoss – above the last local maximum.
Temporary correction is possible – we watch PCCI dynamics and at an opportunity – we add volume.
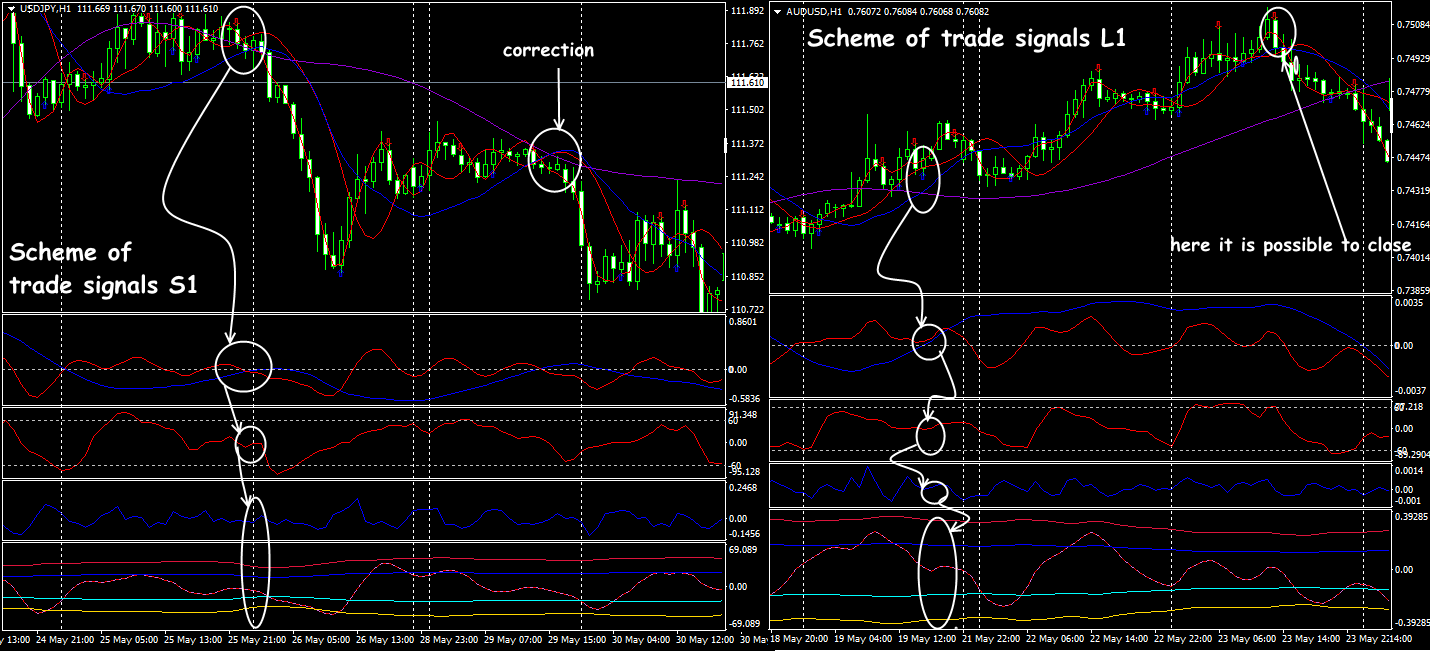
Conditions for the transaction for sale
- the first bull corrections on the descending trend must be before a signal;
- price falling on the growing STLM;
- the converging of the SATL and RATL lines;
- we open the transaction at a turn of FTLM and RBCI indicators down;
- StopLoss – above the last local minimum.
Signals of double divergence of indicators (S4 and L4)
The situation is possible when the values of the FTLM indicator are close to zero. The advancing signal visually looks as a weak turn of the FTLM line to the FATL line (from below up – for sales, from top to down – for purchases).
For transactions for sale:
- must be a slow ascending trend with the multidirectional movement of the RBCI (down) and FTLM (up) lines;
- the formation of a minimum of FTLM, provided that FATL and RBCI keep the directions, is a signal.
The transaction opens at the Open price or above.
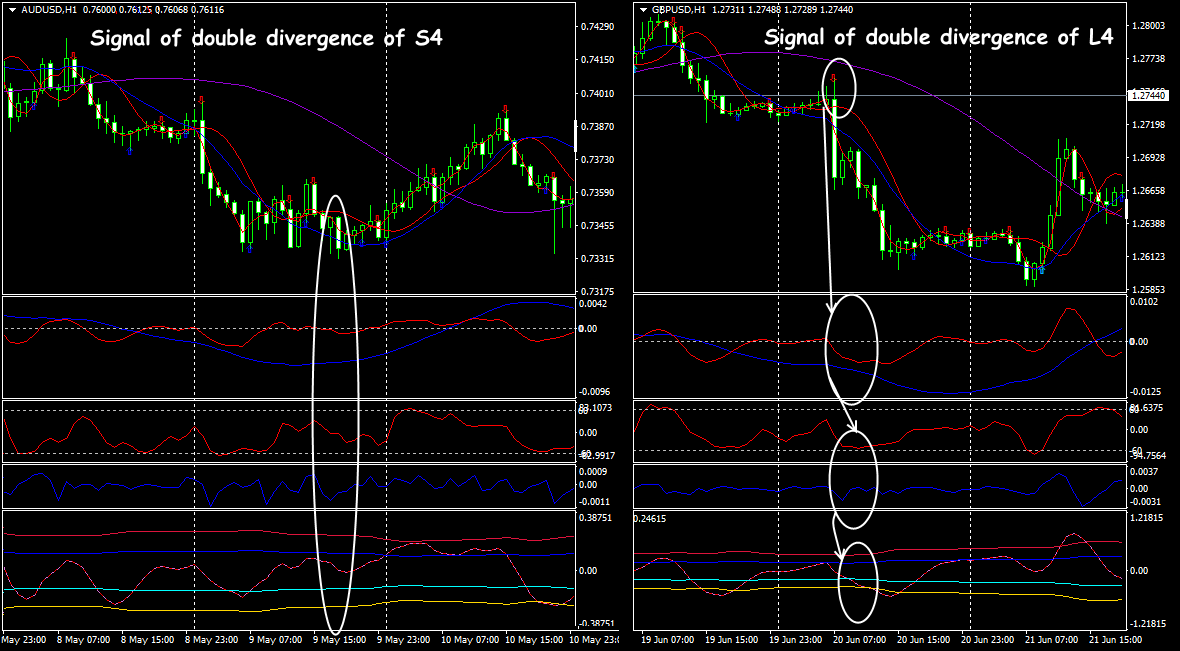
For purchases:
- must be a slow bear trend with the multidirectional movement of the RBCI (up) and FTLM (down) lines;
- the formation of a maximum of FTLM, provided that FATL and RBCI keep the directions, is a signal.
The transaction opens at the Open price or below.
Strong signals of a turn (S7 and L7)
For an entrance against the current bull trend (sale):
- strong breakthrough by the FATL line of the SATL line from top to down.
- we sell on a FATL indicator maximum after the first technical correction of the descending trend up.
We open the transaction at the price of the opening or above.
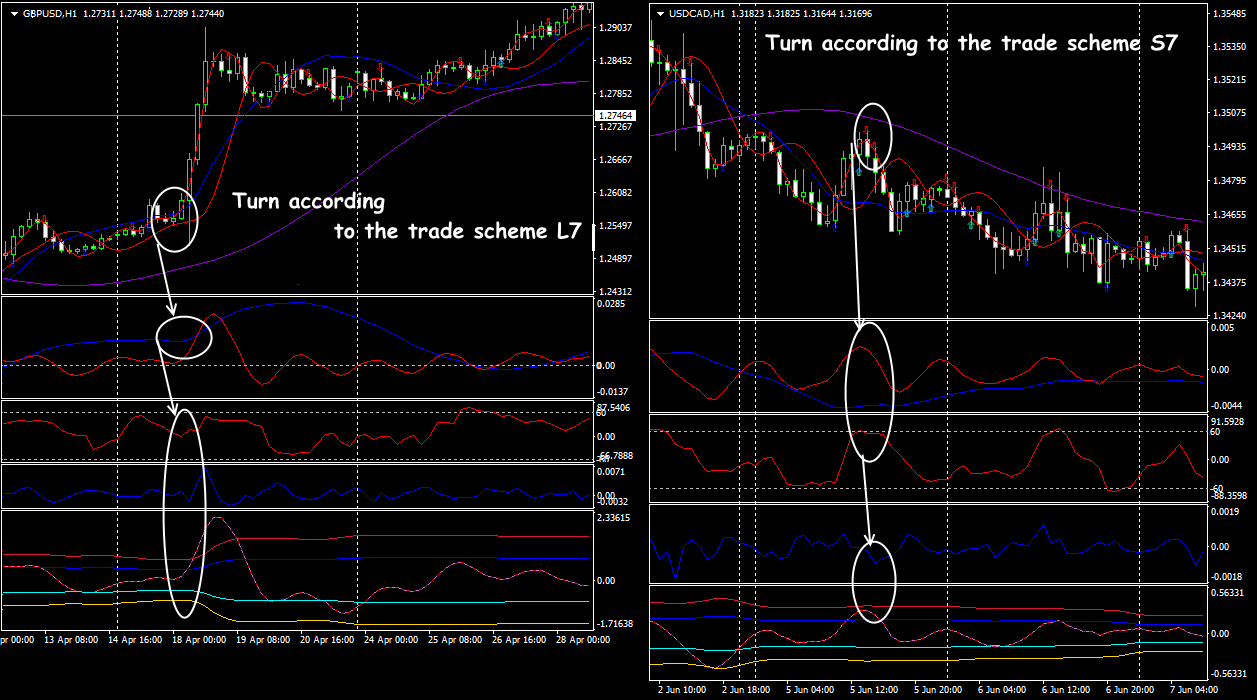
For an entrance against the current bear trend (purchase):
- strong breakthrough of the SATL line by the FATL line from below up;
- we sell on a FATL indicator minimum after the first technical correction of the ascending trend down.
We open the transaction at the price of the opening or below.
Several practical remarks
This system of indicators don`t care about what trade asset you offer – it perceives everything as the digital array and doesn't depend on a news background, and therefore the fundamental analysis isn't used in this system. It is considered that news splashes in the price are just considered in the current calculation of values of the indicator.
As if didn't convince you not to use adaptive indicators together with classical – don't believe. The symbiosis of such methods yields rather stable results.
The periods below H1 aren't recommended at all, it is the best to use H4-D1 above for currency pairs and cross-assets.
If STLM and FTLM indicators move together in one direction, then we don't open the transaction against them.
If the STLM indicator accurately moves up (down) – opens only in his direction.
On a turn of «fast» FTLM and RBCI indicators, it is possible to be added to open positions from extreme points down (up).
These are not all signals and rules, it is much bigger them, it is necessary to test on a concrete trade asset before application, some indicators (most often, REI) may be excluded.
The system doesn't make recommendations about a money management, it is just a set of technical tools.
And as the conclusion …
Forex adaptive indicators − essentially new approach in the market analysis which is actively used in trade technologies of large players and the medium-term forecast, at least, is important for them. The system in an optimum way adapts under the current market, isn't late at all, it doesn't depend on the broker and trade conditions. Telling the truth, it has no parameters of thin tuning, but even when using standard recommendations the set of indicators shows a positive on all main pairs (EUR/USD shows the best results), time frame – not less H1, otherwise, we receive the mass of «false» signals.
The profitable result is important for any investor and to understand in detail method details – optional. The ordinary traders who aren't tempted in mathematics and methods of a digital filtration are recommended not to bother concerning a calculation procedure and to pay attention not to formulas, but their trade interpretation and practical results. Separate Forex adaptive indicators can be used instead of standard, but the most reasonable are using them as the automated analytical system which could define the most probable among the mass of possible signals.
The AT&CF system is of interest to any category of the investors ready to put in medium-term trade strategy.
Social button for Joomla