

")
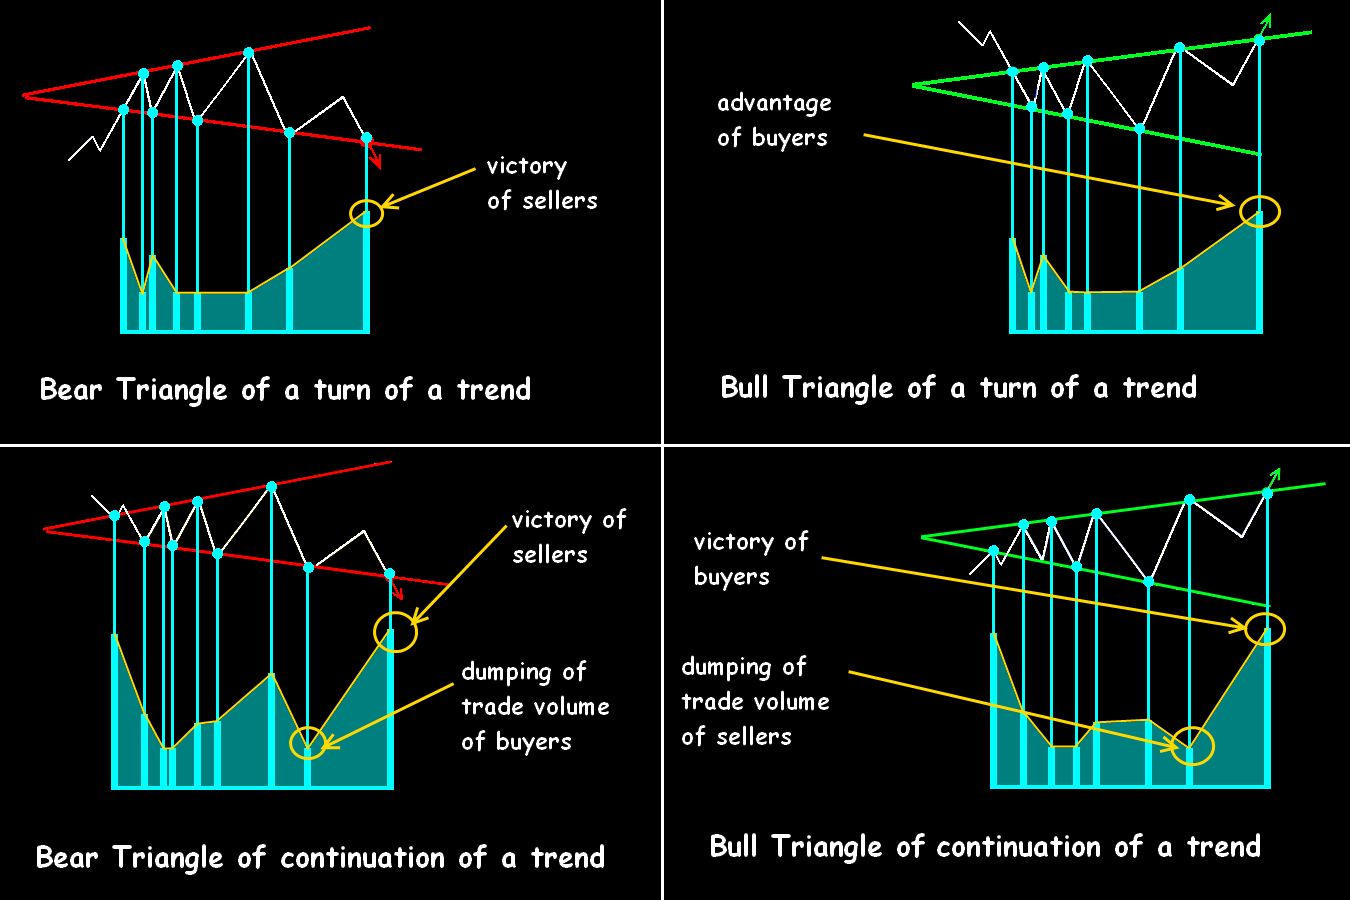
It is a favorite graphical figure of large speculators because the Forex Triangle with equal probability can be both models of continuation of a trend, and a turn figure. Inside of such constructions the market is consolidating, warns about the forthcoming throw and if to learn to understand such signal, then the profitable transaction is provided to you.
Despite the external simplicity, in a technical analysis triangular price models hold a specific place. The pattern has a set of options, arises on any assets, periods, amounts, is easily recovered after news throws and gaps. Any correction deserving attention also appears in the form of the Forex Triangle. The classical treatment assumes emergence of a trading signal after the breakthrough of bounds of a figure and subsequent rather strong movement of the price, at least, for the height of the basis of the constructed model.
The Forex Triangle is a basis for a set of figures of the visual analysis (the Flag, the Pennon, the Rectangle, Diamond), but the closest to it according to schemes of developing is the model Klin so we will consider these two families of patterns, as they say, in a set.
Forming scheme of the Triangle
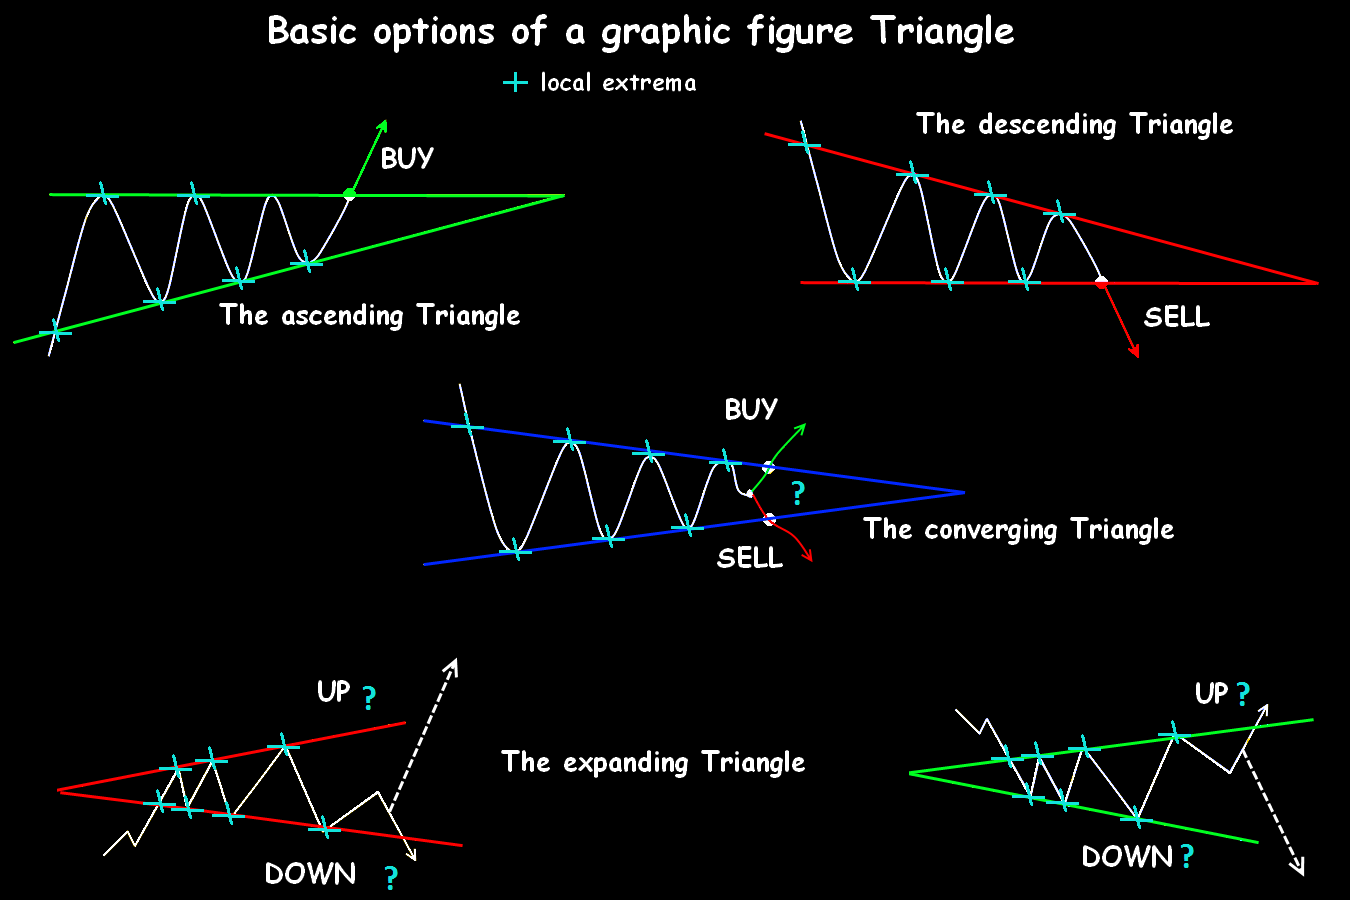
The standard pattern is the graphical model containing two lines (sides) constructed on a line of local extrema – at least 2-3 on each direction. The sides are always supporting/resisting and always have a cross point, actual or settlement. For the option of the dispersing Triangle, such point is located in «past», that is to the left of the price, for all others – in «future», to the right of the current price. If the model is directed down – we have a bear Triangle, up – bull, if an inclination of the sides approximately identical − symmetric or dispersing.
The fact of the breakthrough of the upper or lower bound is considered a trading signal.
The trade purposes according to the Forex Triangle model
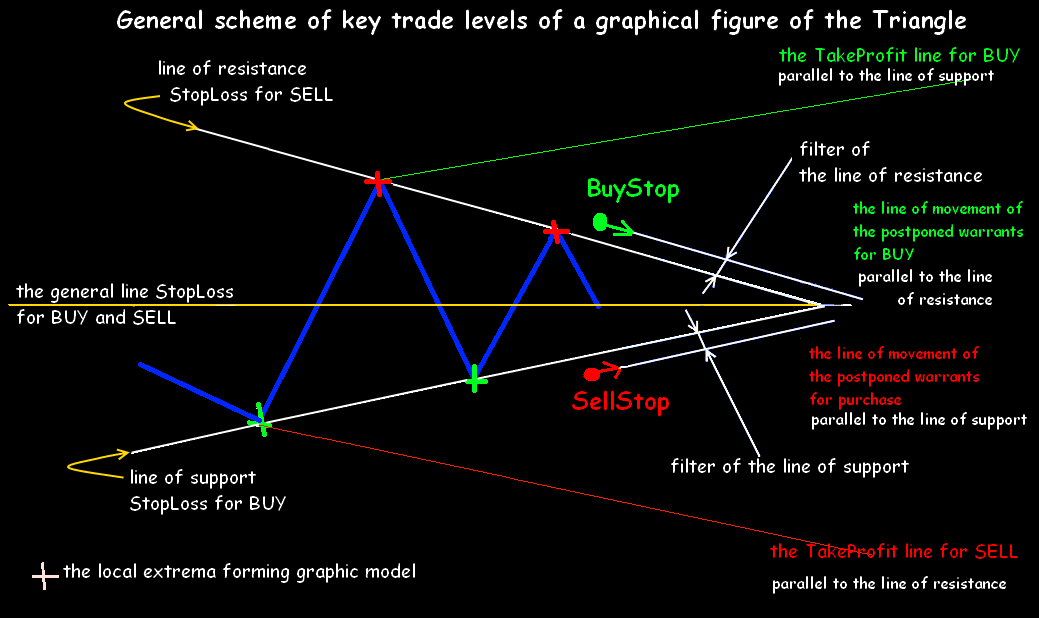
Usually, the target point is determined as the distance equal to the widest part of the Triangle which is protracted from a point of true breakthrough. In standard option for determination of the purposes in case of breakthrough up through the upper point of the basis, the line parallel to the main support is constructing, for breakthrough down – is similar to the line of resistance. These lines are the minimum price reference points.
In general, according to the volume of a profit, we may offer:
- the certain fixed volume (on a standard money management);
- the TakeProfit allocation on the line parallel (not breaking) bound of a figure (support/resistance);
- the TakeProfit allocation on the highest local maximum (in the case of a breakthrough of resistance), or on the lowest minimum – in the case of break of the support line.
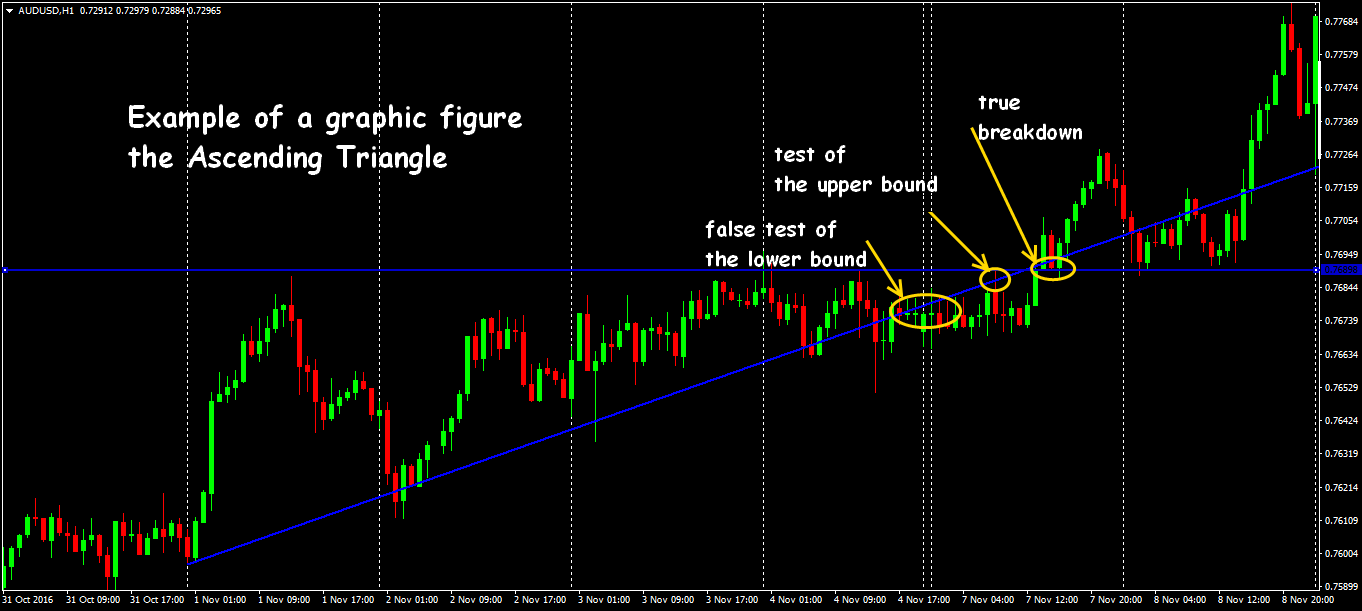
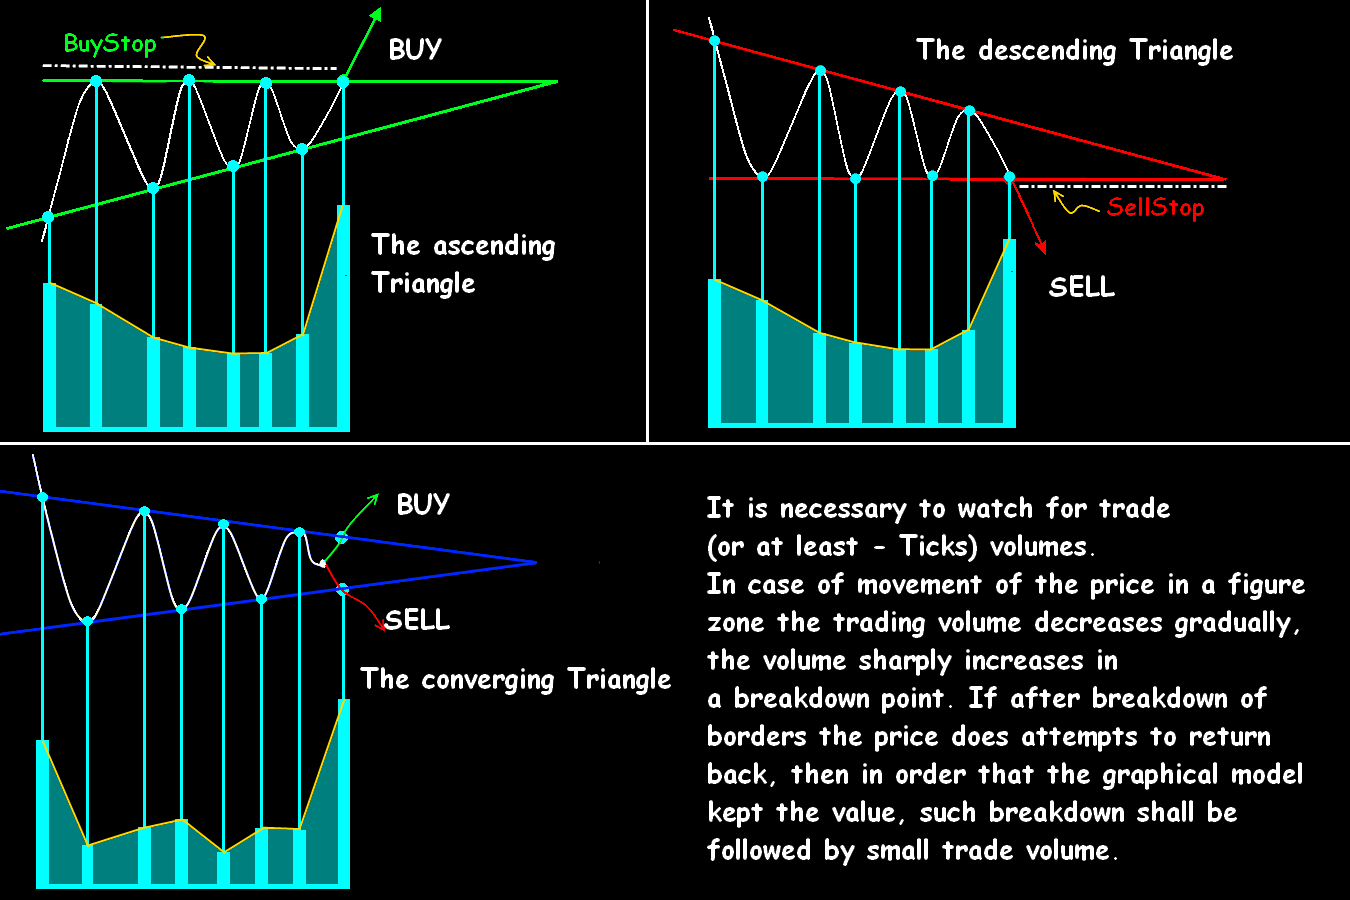
The ascending Forex Triangle
The Bull or Ascending Triangle – the figure consisting of the horizontal level of resistance and the sequence of the growing minimum. It is meant that the bull trend is already on the market, but the buyers aren't able to overcome the local level of resistance within some time. In most cases, such Triangle is treated as consolidation model before the continuation of a trend, as after complete forming of a figure the price breaks the upper bound. The postponed orders for purchase are usually above it. As approaching a settlement point of the breakthrough amplitude of fluctuations in model decreases.
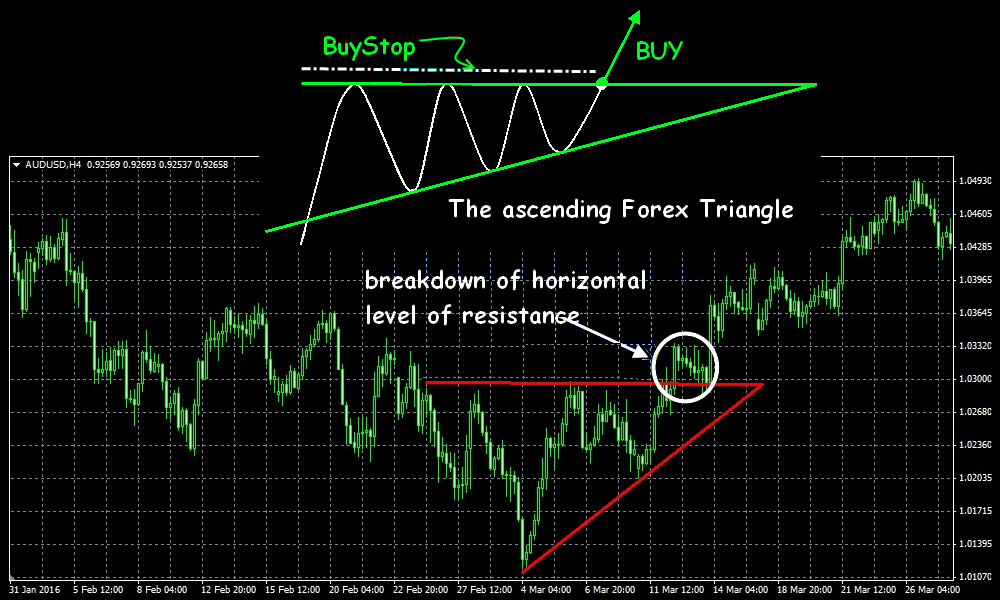
The «correct», strongest signal arises in the case of a price entrance to this pattern from below and steady breakthrough of the line of resistance up. If the price is entering into the Triangle zone from top to down, but further there is a breakthrough of the upper bound – the bull signal is considered weak.
Sometimes the bull Triangle is created as turn model at the end of the descending tendency, then after a price entrance to a figure zone from above and breakthrough down of inclined bound, the bear breakthrough looks the most probable – there is an average signal for sale.
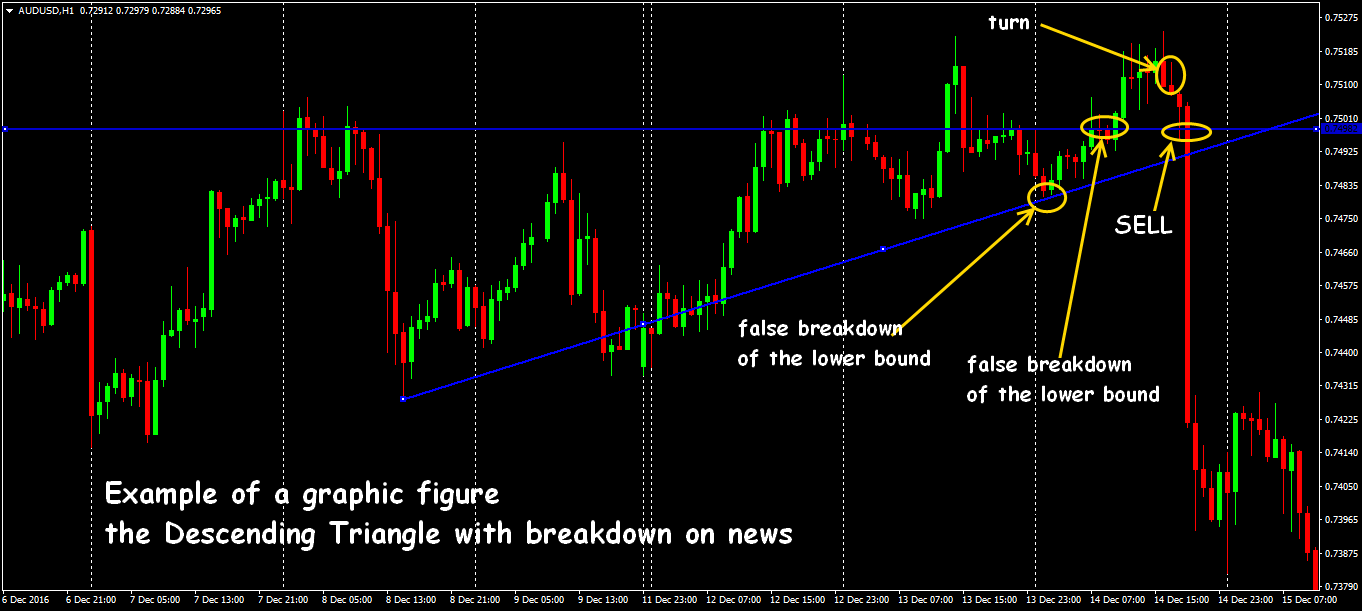
The descending Forex Triangle
The lower bound of a figure is the horizontal line (rather, a zone – as a first approximation) of support, the upper bound – consistently decreasing maxima. The Bear or Descending Triangle means there is a bear trend in the market, but buyers try to protect the local level of support, as a result − sellers can't pass it for some time. The amplitude of fluctuations falls as approaching a breakthrough point then the global descending trend proceeds.

Most often the lower bound of a figure is breaking through, therefore, behind it usually put the postponed orders for sale.
The strongest signal arises in the case of a price entrance from above and breakthrough down of the horizontal bound. If the price is entering into a model zone from below up, but, as a result, then breaking the lower bound down – the signal for sale is considered weak. When sellers lack the last effort for the breakthrough, then as a result of the fight there is rather strong a false breakthrough, then the price turns in the direction of the greatest amounts – it often happens on news.
If the bear Triangle is created on a strong bull trend, and the price in entering to a model zone from below up, then a bull breakthrough of the inclined bound will be the most probable. At the same time, the average signal on the purchase appears.
The descending Triangle always forecasts fall of the price, irrespective of a prior trend.
Psychologically the large volume of false orders for purchase appears on the price of support – bulls expects the price will go up from this level. And bulls buy again every time in the case of the test of the level and, therefore, they force the price to create a new maximum, though in general, the market is already bear. After the next test reaction of sellers accelerates, because, in the case of the growing offer and almost stable demand, the price can't long stay put – it will fall. So you have to check a situation on seniors timeframes.
The converging Forex Triangle
Symmetrical or Converging Triangle is the option of the model, which represents an isosceles Triangle in which the price converge in one point (certainly, theoretically). The amplitude of the price which is reduced inside of it can lead to breakthrough both down, and up. Though such figure is considered neutral, but even on an average trend, the probability of breakthrough in the main direction is much higher.

As a rule, establish two postponed: over the upper bound − on the purchase, under the lower bound − for sale. Orders can be moved gradually at the change of bound level.
Expanding Triangle
Such pattern (expanding Triangle), is the return to a symmetric Forex Triangle when the sides shall be located under an approximately identical corner to the horizon and a settlement point of lines crossing − to the left of price movement. The figure is created for a long time, therefore, inside a zone the local max/min which aren't reaching bounds are possible. The model appears rather seldom and means a condition of long uncertainty after completion of a strong trend. At this time the players following the previous trend stop the positions because of a high oversold/overbuy of the asset − they are temporarily not ready to new risk. Then swing traders begin to shake the price, forming of model begins by the weak movement on low amounts, and then the construction gradually extends due to the opening of new positions.
It is extremely dangerous to work on expanding Triangle as the accurate signal on an entrance arises only in case of true breakthrough and fixing to figure bounds. But if it happens, then the price with the most probability will move in the direction of the breakthrough.
If the scope of an expanding Forex Triangle rather small, then it is better to wait until the price is determined the direction. If the model already has an amplitude at the level of a daily average volatility, then you may try to trade in the Forex Triangle by regular rules, using retests of bounds as a kickback in one of the sides, at least, to the average line of a pattern. SellStop/BuyStop orders are traditionally moved at some distance from lines of support/resistance, also possible to combine the target levels with Fibonacci's level from the last movement.
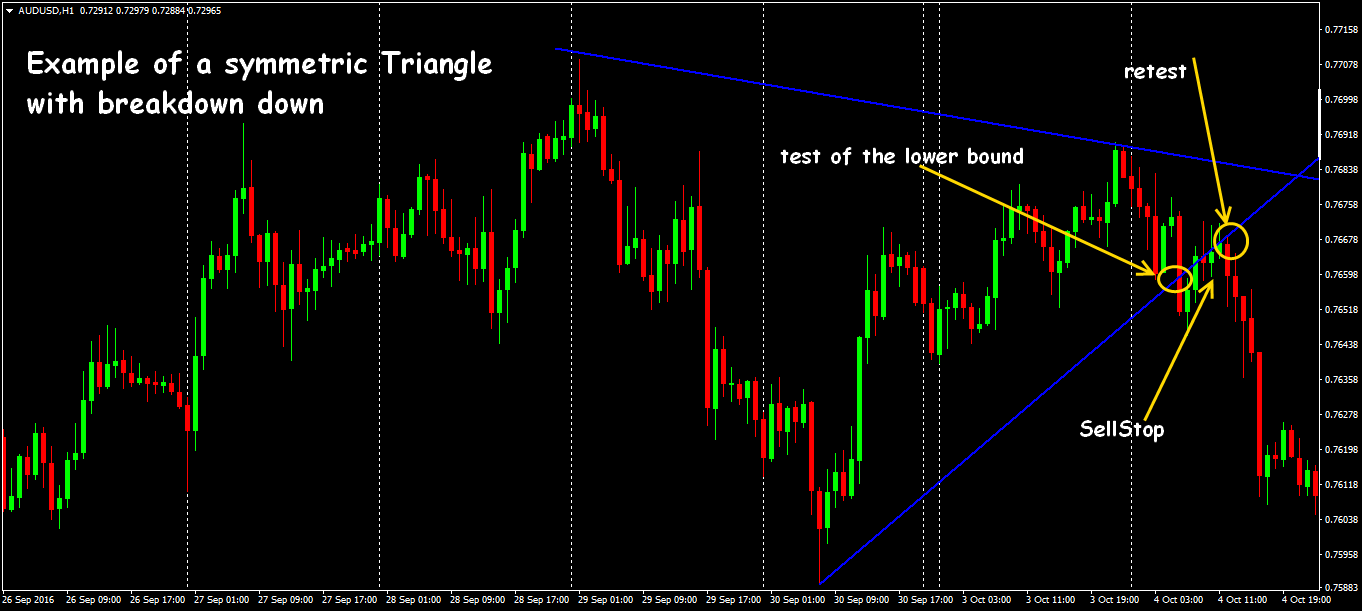
Example of symmetrical Triangle
Breakthrough of the bound of a pattern will be the first signal which shall draw our attention, then you should wait for a retest (at least – one!), and only after that, you may place pending orders on max/min of this test fractal. StopLoss you may arrange both behind the last significant fractal, or according to a regular money management. Further, you may draw the stop by trailing, with the fixed step or, for instance, on key points of ATR. After one order operated the second is recommended to remove.
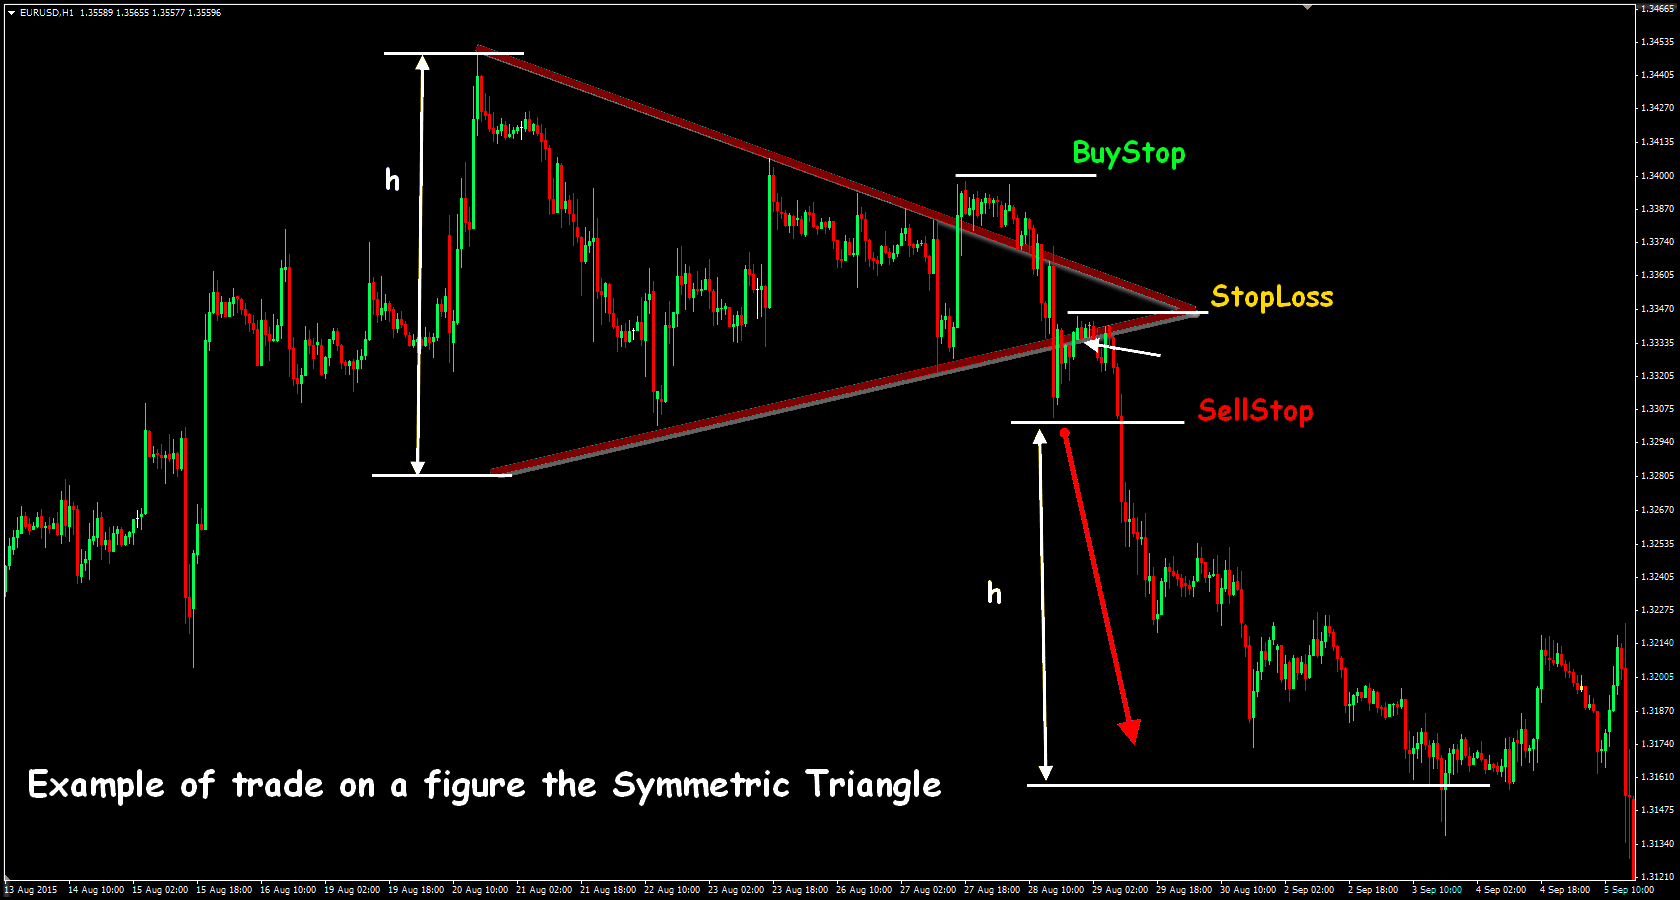
The accurate model is on the scheme, the fact of breakthrough and retest (from top to down) the upper bound is visible. The breakthrough was false, the placed BuyStop wasn't necessary, the price was turned down, broke the lower bound and SellStop located below test min successfully fulfilled. Initial StopLoss was located above the last local maximum.
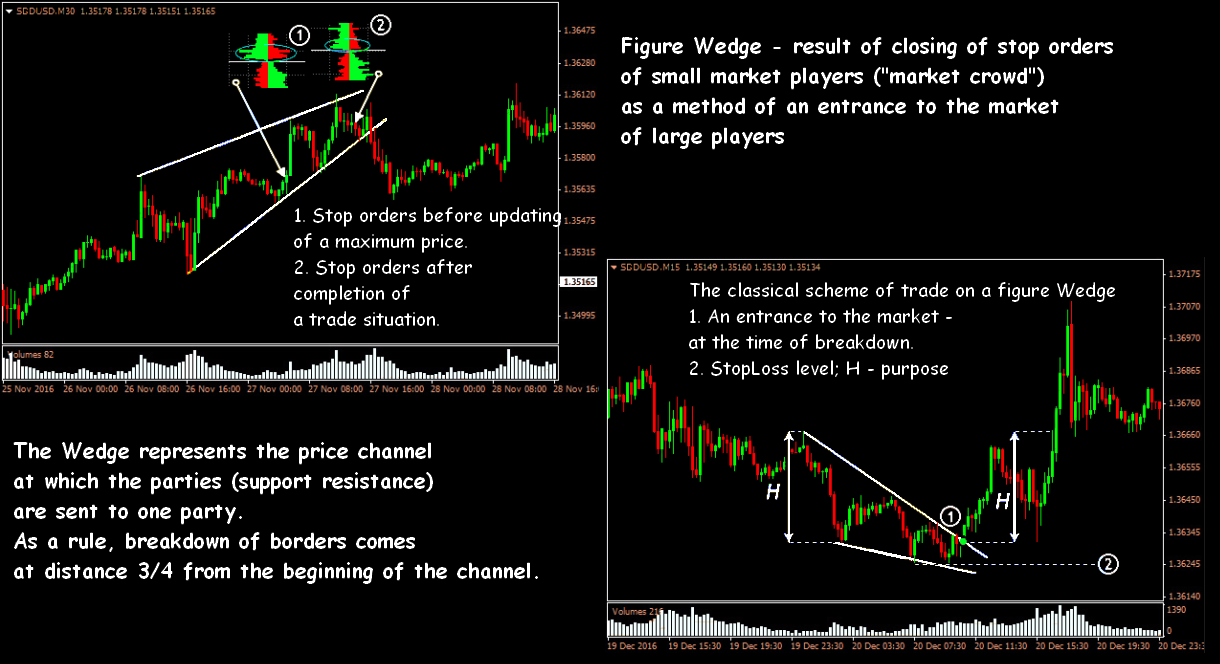
More difficult version of the Forex Triangle – Wedge model
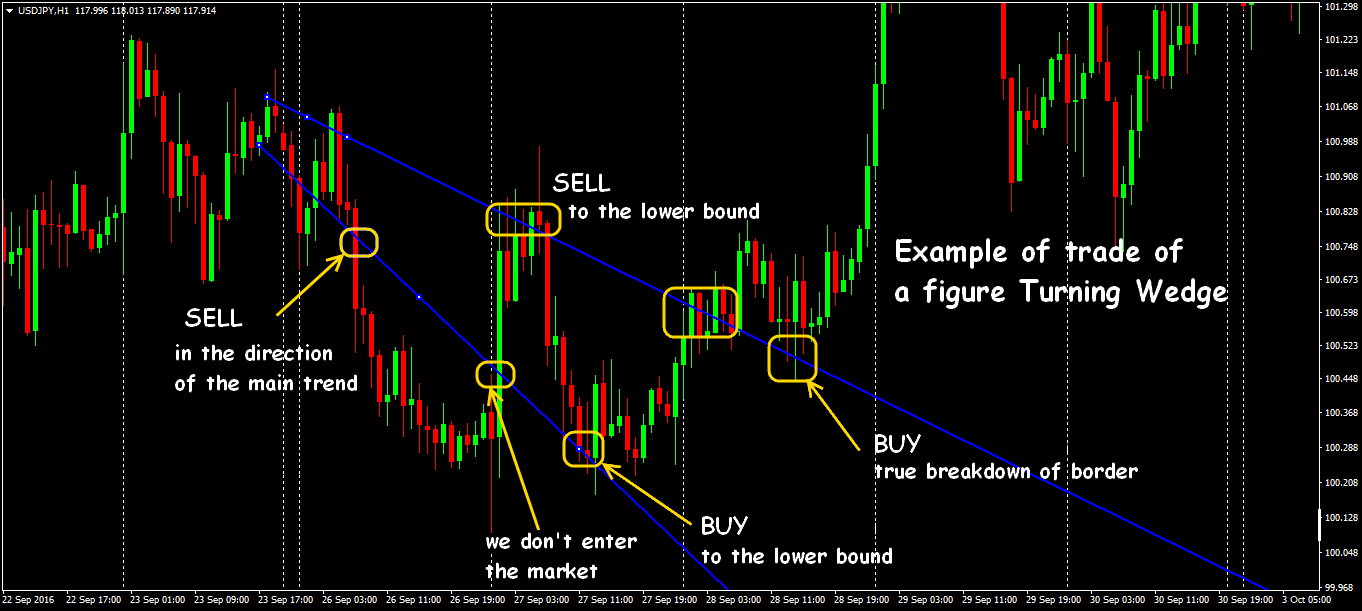
Unlike the relative Wedge depends on a market situation much more (from the amount of speculators in the market) and equally maybe a turn figure, and a figure of a continuation of a trend. Geometrically Wedge looks as a regular trend construction (channel), that is both bounds shall be sent to one side. Turning Wedge goes along the current trend, and Wedge of a continuation develops a correction.
Sometimes Wedge reminds very much the Triangle with flat bound, but if on the Triangle market makers specially create conditions for accumulation of orders near key levels, then in the case with Wedge these orders reflect real market interest and are created by a regular method, but constantly the same speculators get off them by short-term transactions in large volume. The subsequent sharp return of the price to the figure range just also says that at the moment the impulse in this side isn't interesting to serious players, and they just earn on market plankton.
Much more time and accurate, but not necessarily «cool» trend will be required to really create the Wedge according to the theory. The Wedge can be bull or bear, in the direction of a trend (Wedge continuations) or against it (Wedge of a turn), but on any trade assets such medium-term or longer model is steadily fulfilled.
All models of Wedge on the timeframe less than an hour have the mass of false signals and are quickly enough transformed to more habitual, popular patterns.

Any version of a Wedge can be a figure of a turn, but it sometimes lacks «force» to break a trend, then that`s a moment of creation of continuation model. Active market manipulations − removal of StopLoss of small participants and forming of amounts of positions by large players − are necessary for Wedge creation.
After small StopLoss/TakeProfit orders are accumulating on both sides of the key range, they are regularly forced down by large players and, as a result, max/min are updated, but it isn't really deep, not to disturb large interest, then the price quickly enough returns to the model range. Depth (amplitude) of kickback gradually decreases as the market prepares for a turn. Further, depending on amount against a trend, either a complete change of the direction or correction is implemented.
The ascending wedge signals about the pressure of sellers (growth is slowed down), that is the prices still update the current maxima, but in general amplitude decreases and the figure meeting up is created.
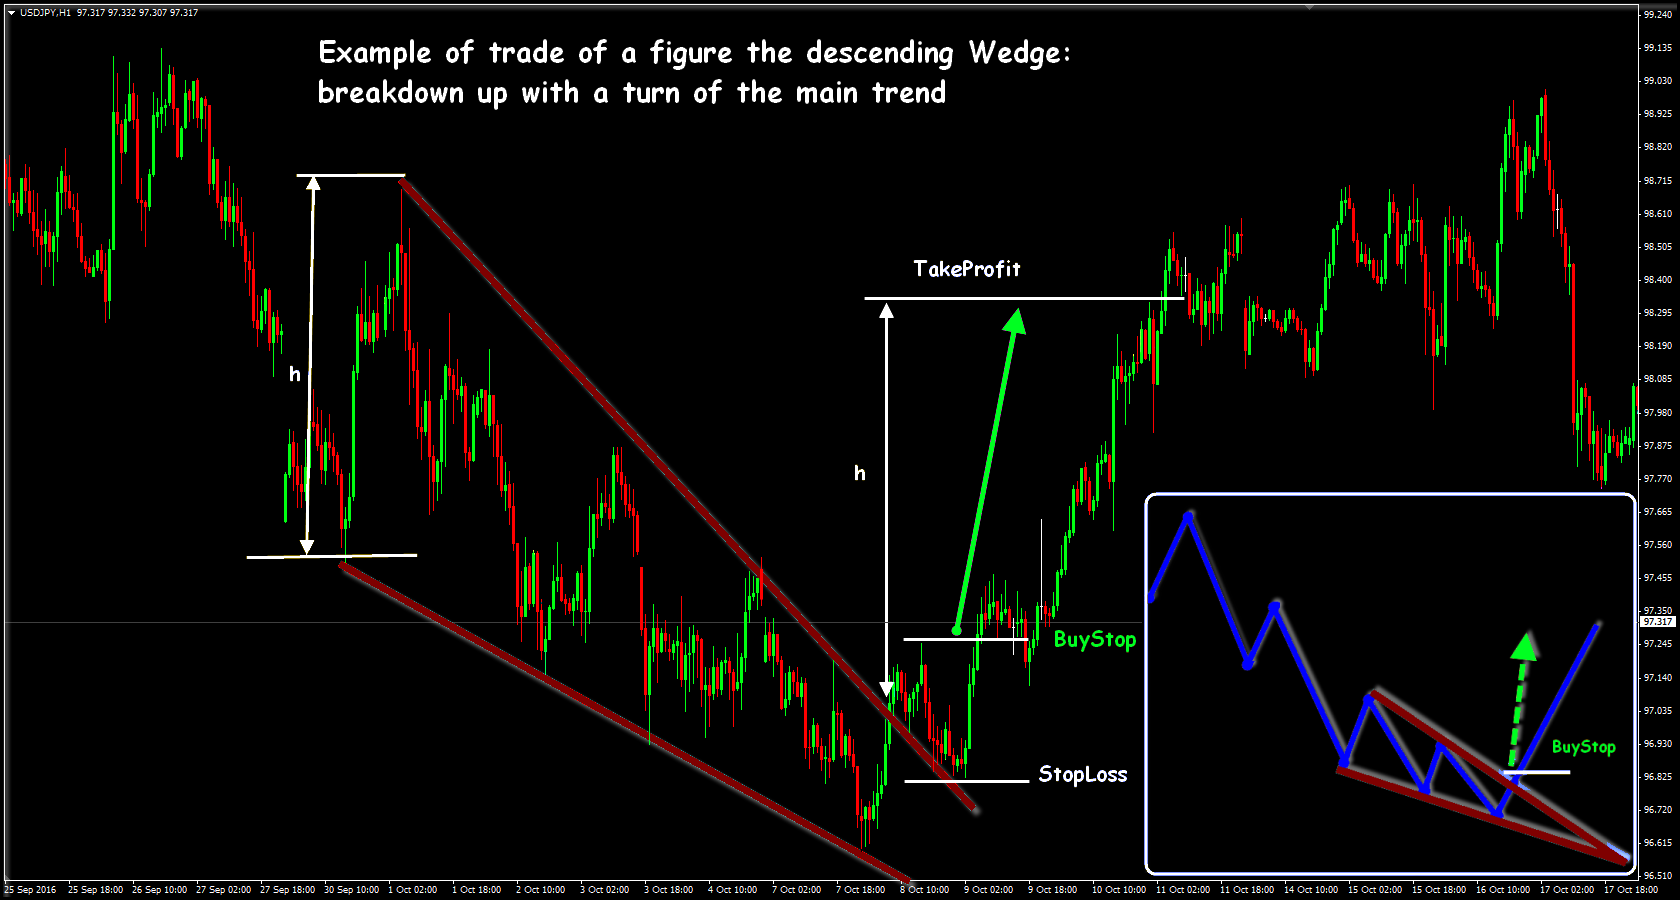
The descending wedge is shown on the interest of buyers (fall is slowed down) and weak updating of minima − the point of a convergence of model is located below the current levels.
In the case of wedge fulfilled you have to track trade volumes in the course of forming, and dynamics of amounts reminds not a Triangle, and one more its option – the Pennant model.
Trade on a Wedge figure
The postponed SellStop/BuyStop orders are traditionally used behind levels of the probable breakthrough of bounds. An arrangement of orders are adjusted in process of movement as close as possible to the break price:
- if the pattern goes up − sale after the breakthrough of the lower bound;
- if wedge goes down − we buy after the breakthrough of resistance.
The requirement − closing of the current bar lower the lowest (or above upper) bounds and an entrance after a retest. To reduce mistakes in case of false breakthroughs, you may put postponed orders on the previous fractal.
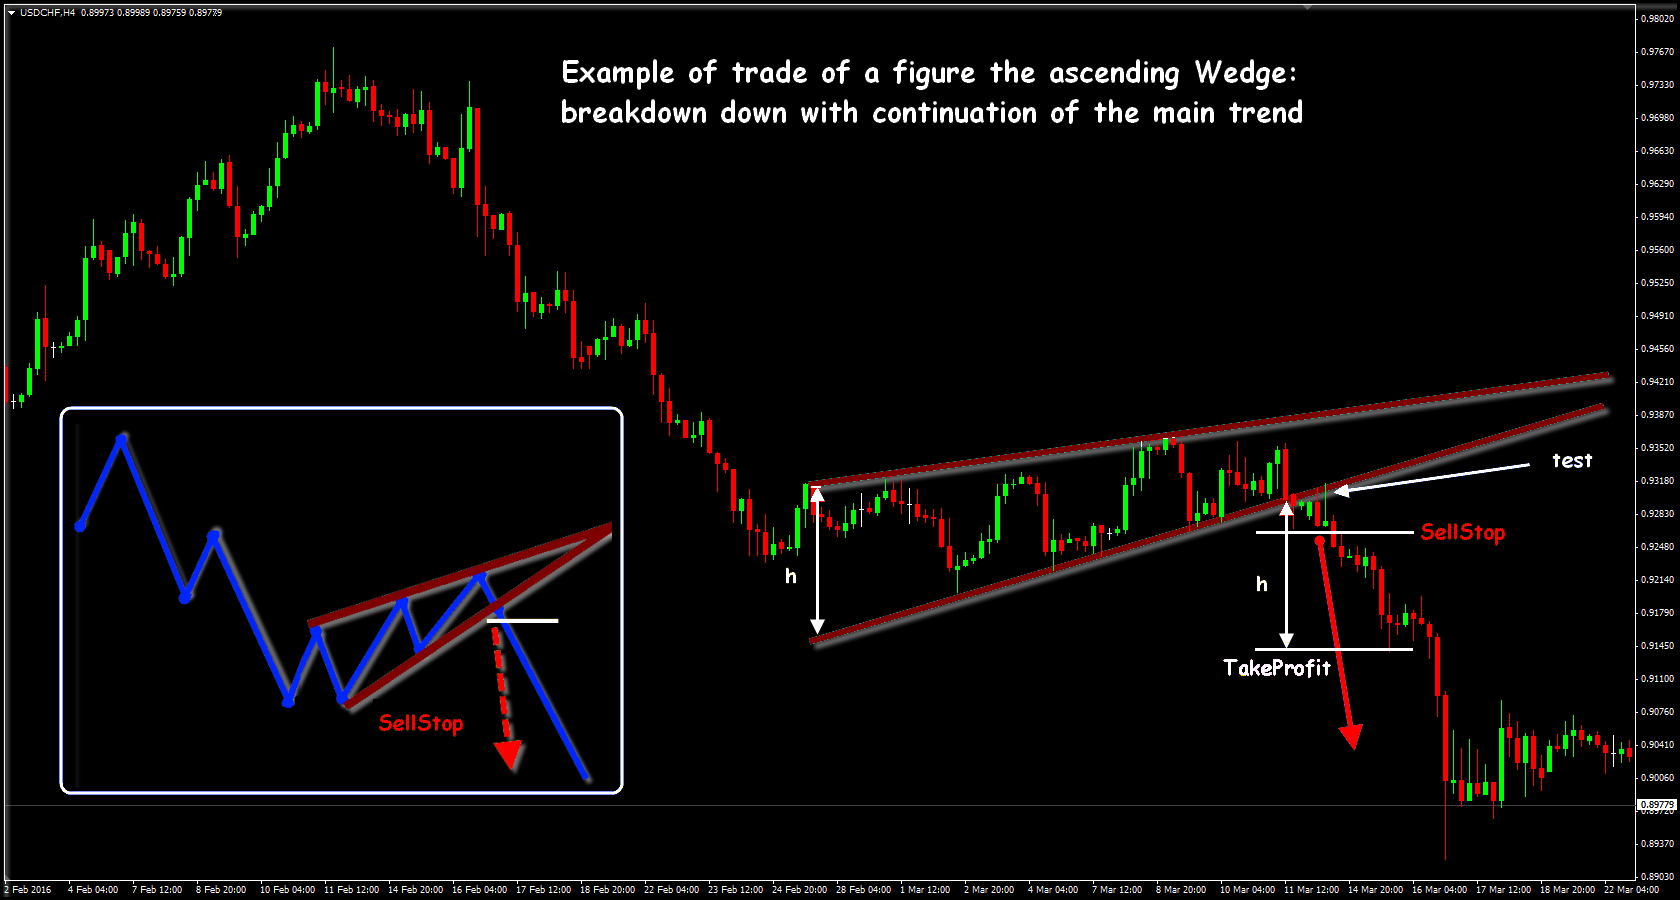
According to the theory, the price shall pass model height distance after the breakthrough, but level for the first Take Profit or partial closing is recommended to be chosen near 60-70%h.
For the turning model which is usually created on the weakening trend requires confirmation from additional indicators: bull wedge will turn a trend down, and bear – up.
The model on «floor» of the market is shown below. The entrance is fulfilled according to the postponed BuyStop order on the price of breakthrough, we put StopLoss lower than the level of a retest, and TakeProfit − at the level h from the upper bound.
The example for a model of the ascending wedge is below: after some flat, the market fulfilled down approximately 70%h.
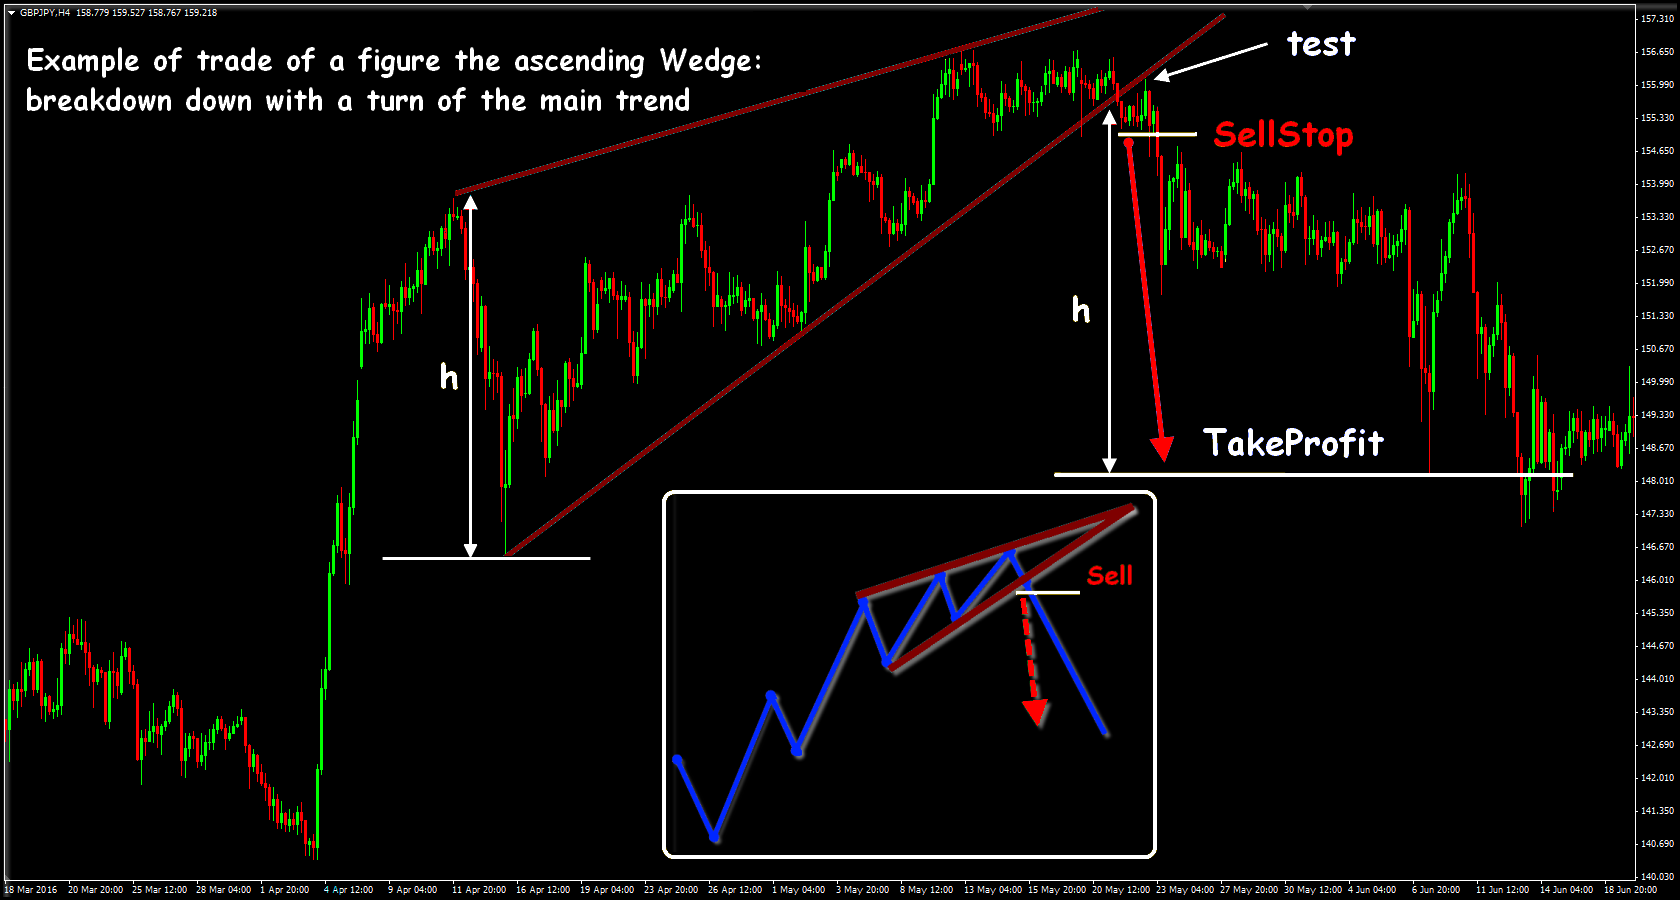
Often Wedge of continuations looks as a usual correction to a strong tendency. The example is lower: after a retest, we put SellStop under the next minimum, StopLoss on max of a retest.
Work rules with a Wedge figure
Wedge — a figure rather difficult, because of permanent updating of extrema it is difficult to identify and fulfill it. The main model problem – its instability. The correct estimation of a trend and determination of key points is necessary, and in the case of creation of a figure it is recommended to use closing prices to take away speculative «tails».
The Wedge figure shall be created, at least, from three waves and contain 4-5 points for creation of lines of support/resistance. In process of movement, you should adjust the bound.
It`s very difficult to calculate the breakthrough moment, at the same time, if to open the transaction without obvious confirmation, then you may get on the false breakthrough and if to set a goal to wait for a retest of the level, then you may be late with an entrance.
For determination which exactly model of Wedge was created, it`s recommended to use additional signals from:
- … oscillators – for search of divergence and other points of a turn;
- … Fibonacci's levels – for search of the intermediate purposes;
- … Elliot's waves – because the Wedge figure often arises on sites 2-4 of the standard wave model;
- … amount indicators − a reduction of indicators at the end of the model.
There is a problem with target points in Wedge system too, therefore, it is recommended in case of fulfilled by the cost of 20-30% of the height of Wedge already to transfer the transaction in the black, and to include a trailing further.
One more popular strategy of trade on Wedge model is below – an entrance in a swit-zone (a zone from the previous extremum to figure bound).

Some practical notes on the Triangle model
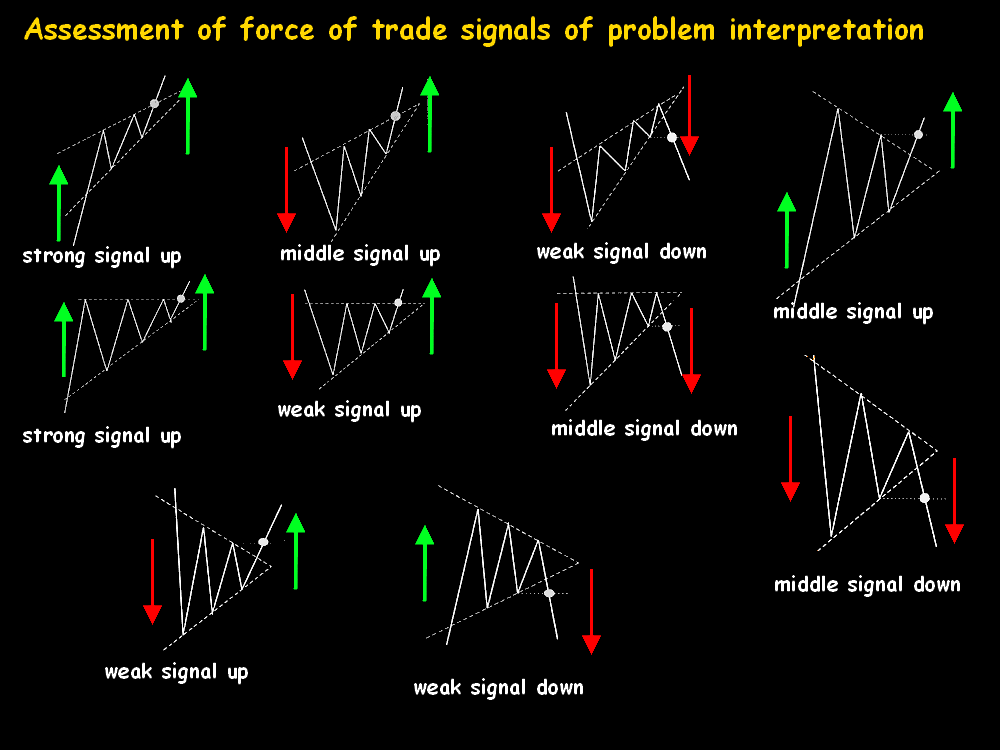
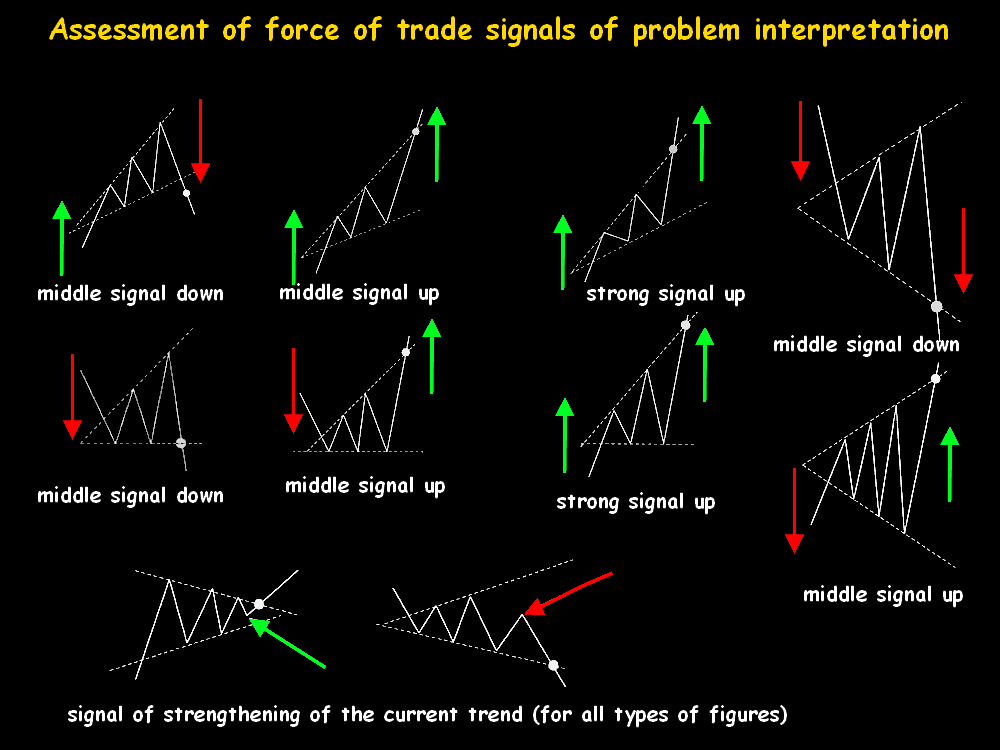
Force of a trading signal directly depends on the direction of the figure and the direction of a breakthrough as all Triangle models belong to the class of graphical models of double interpretation.
According to a classical technical analysis, at least 5 waves requires to the identification of the Triangle, and a total number of waves in a zone of model shall be odd. Extrema of the price shall accurately create lines of support/resistance, and the return price waves − to build opposite bounds. Both lines are considered as active after, at least, two contacts.
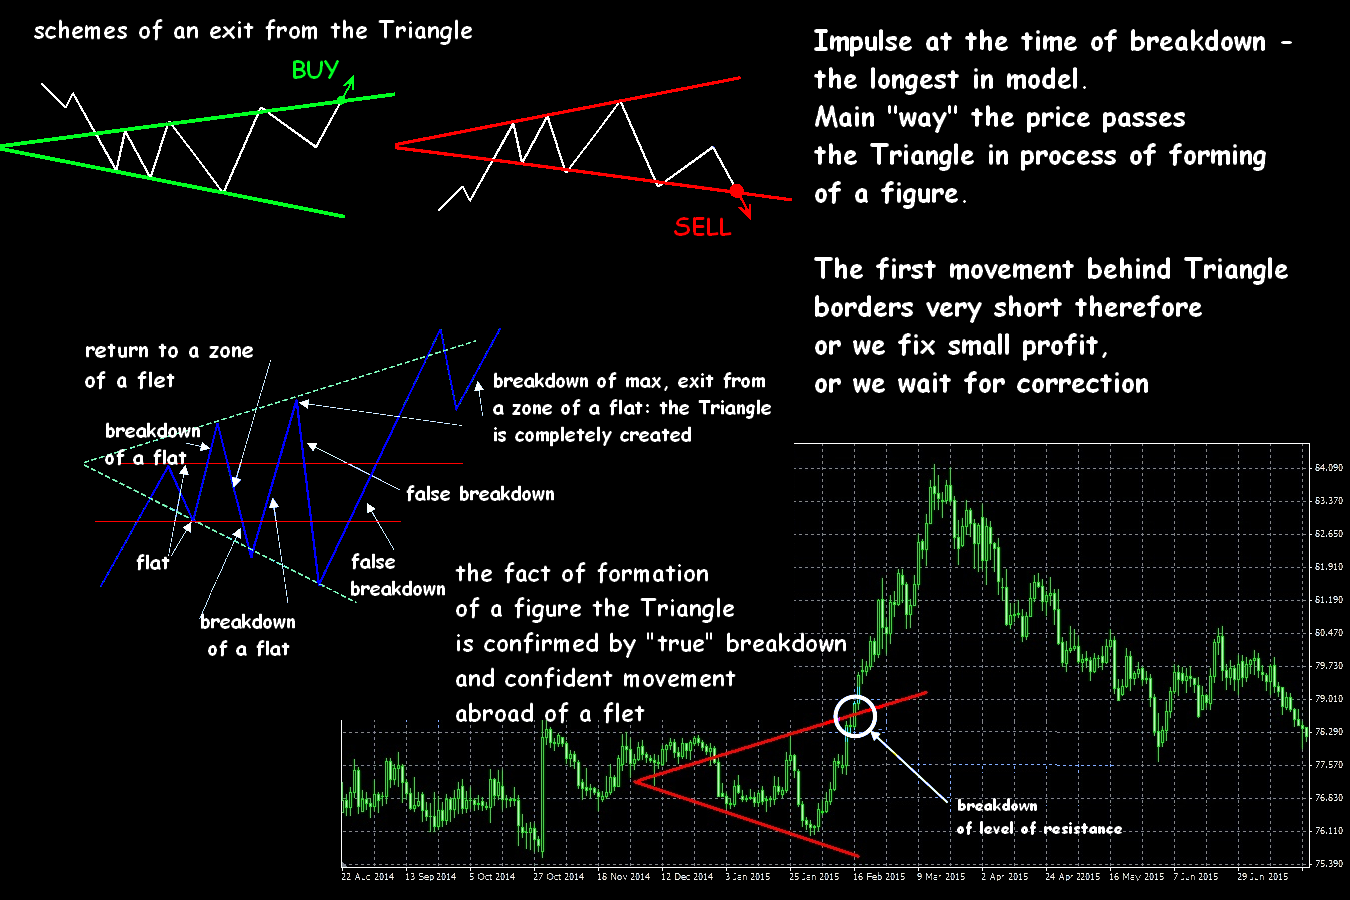
The patterns created in the period, not below H1 are considered as stable. After the breakthrough, the brought bound changes the meaning, and the price «become entitled» to execute kickback from the new level before a new trend. the An approximate scheme of dynamics of amounts in case of trade on the main models is shown below.
It is considered that very quickly exit out of the zone of the model becomes when the last wave of the Triangle doesn't reach the bound and is turned earlier.

The breakthrough of bounds may be at the end of a strong impulse and to be false, for instance, strong news in direct proximity from bound quite can break the model. Unsuccessful breakthrough and return to a model zone in case of gradual reduction of trade volumes can create further a symmetrical Forex Triangle and as a result, construct a strong turning pattern «Diamond».
To exclude an entrance to the transaction on false break, it is recommended to wait for closing of a key candle which has broken the bound. We enter in the direction of a breakthrough only subject to closing of a candle abroad of the model. If the candle is closed in the Triangle, a breakthrough can be considered false.
Careful trade inside of any Triangle is allowed only in case of rather wide (but not maximum!) amplitude of fluctuations. If amplitude too big, then the market is almost ready to make the decision, and it is worth expecting either breakthrough of bounds, or transition in flat in an average zone of a figure (as a rule, before the closing of the week or long holidays). Such trade inside the model isn't recommended to beginners at all.
And as the conclusion …
The uncertainty of the market just is also shown that the Forex Triangle figure meets most often. Externally all versions of the Triangle reflect dynamic market balance when players on both sides actively try, but can't temporarily shift the price in a certain direction. And for forming of any Wedge model are initially assumed special manipulations of the large equity on purpose «to dump» of excess small players and to gain the amount of open positions for serious participants. At the same time, a real fight between purchases and sales can go serious – on critical amounts.
Ability to correct distinguish and choose tactics of work with various options of Forex Triangles is obligatory during the work with any asset and is urgent in any trade conditions. Because even if you won't earn – then, at least, you won't allow to deceive you.
Social button for Joomla