

")

We offer classical graphic models to those who prefer medium-term stable transactions – for skilled, self-confident and patient. The main objective of round Forex figures – to provide effective trade on the small periods, without losing of a global tendency.
Most often «round» patterns appear in the stock market – its assets are initially best of all adapted for a long-term trade. The successful trader and the popular writer of financial trade William O'Neill is considered as the author of an interpretation of models for the forward market: it managed to adapt these figures for D1 and W1 because of the analysis of volumes, though due to the fact of Forex assets high volatility even on the period of H4 it is possible to receive stable results. But in most cases, day time frame is recommended for the analysis and the trade.
Only very patient players can trade on such patterns – all round Forex figures are formed long enough, from 2-3 weeks to several years. Their stability and accuracy of fulfillment grow with the increase in the period and trade on them is recommended, at least, on medium-term strategy.
Trend continuation model
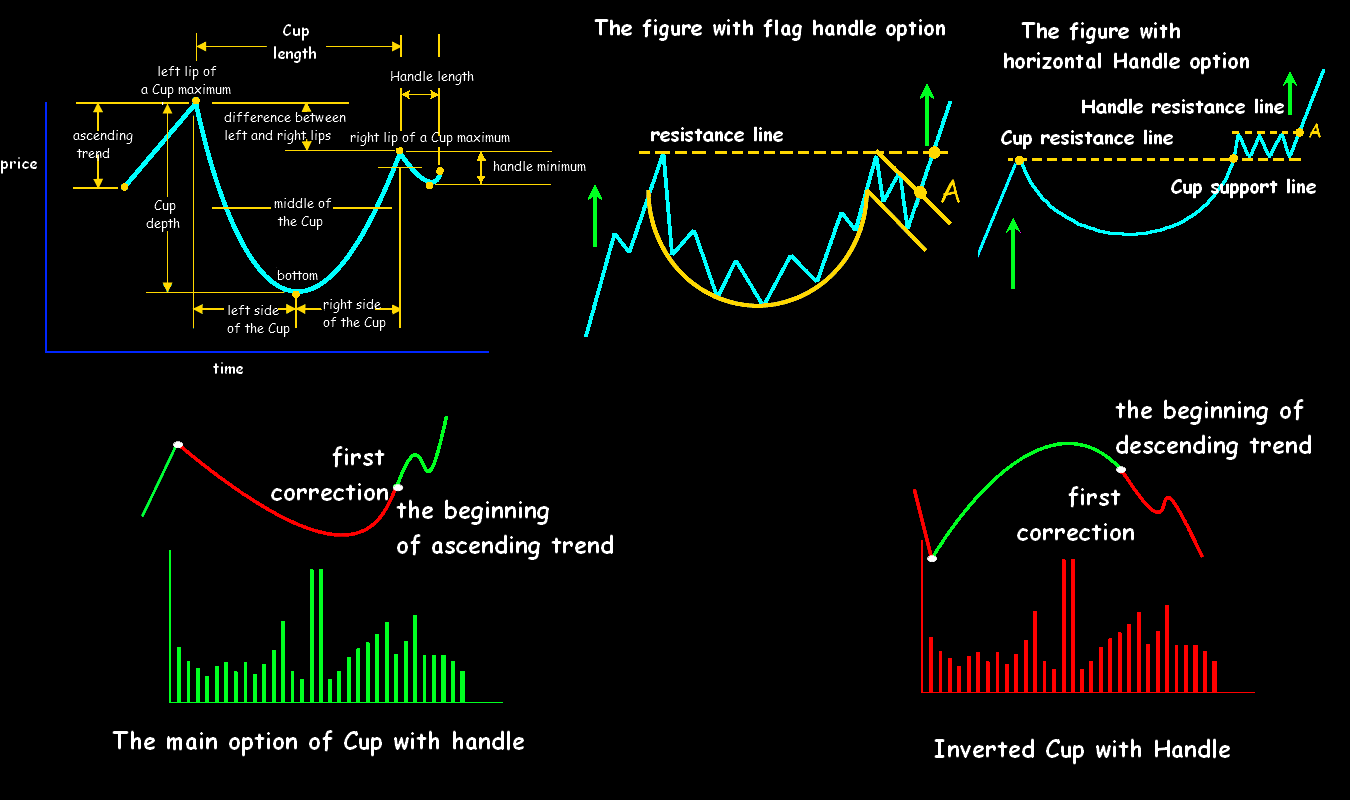
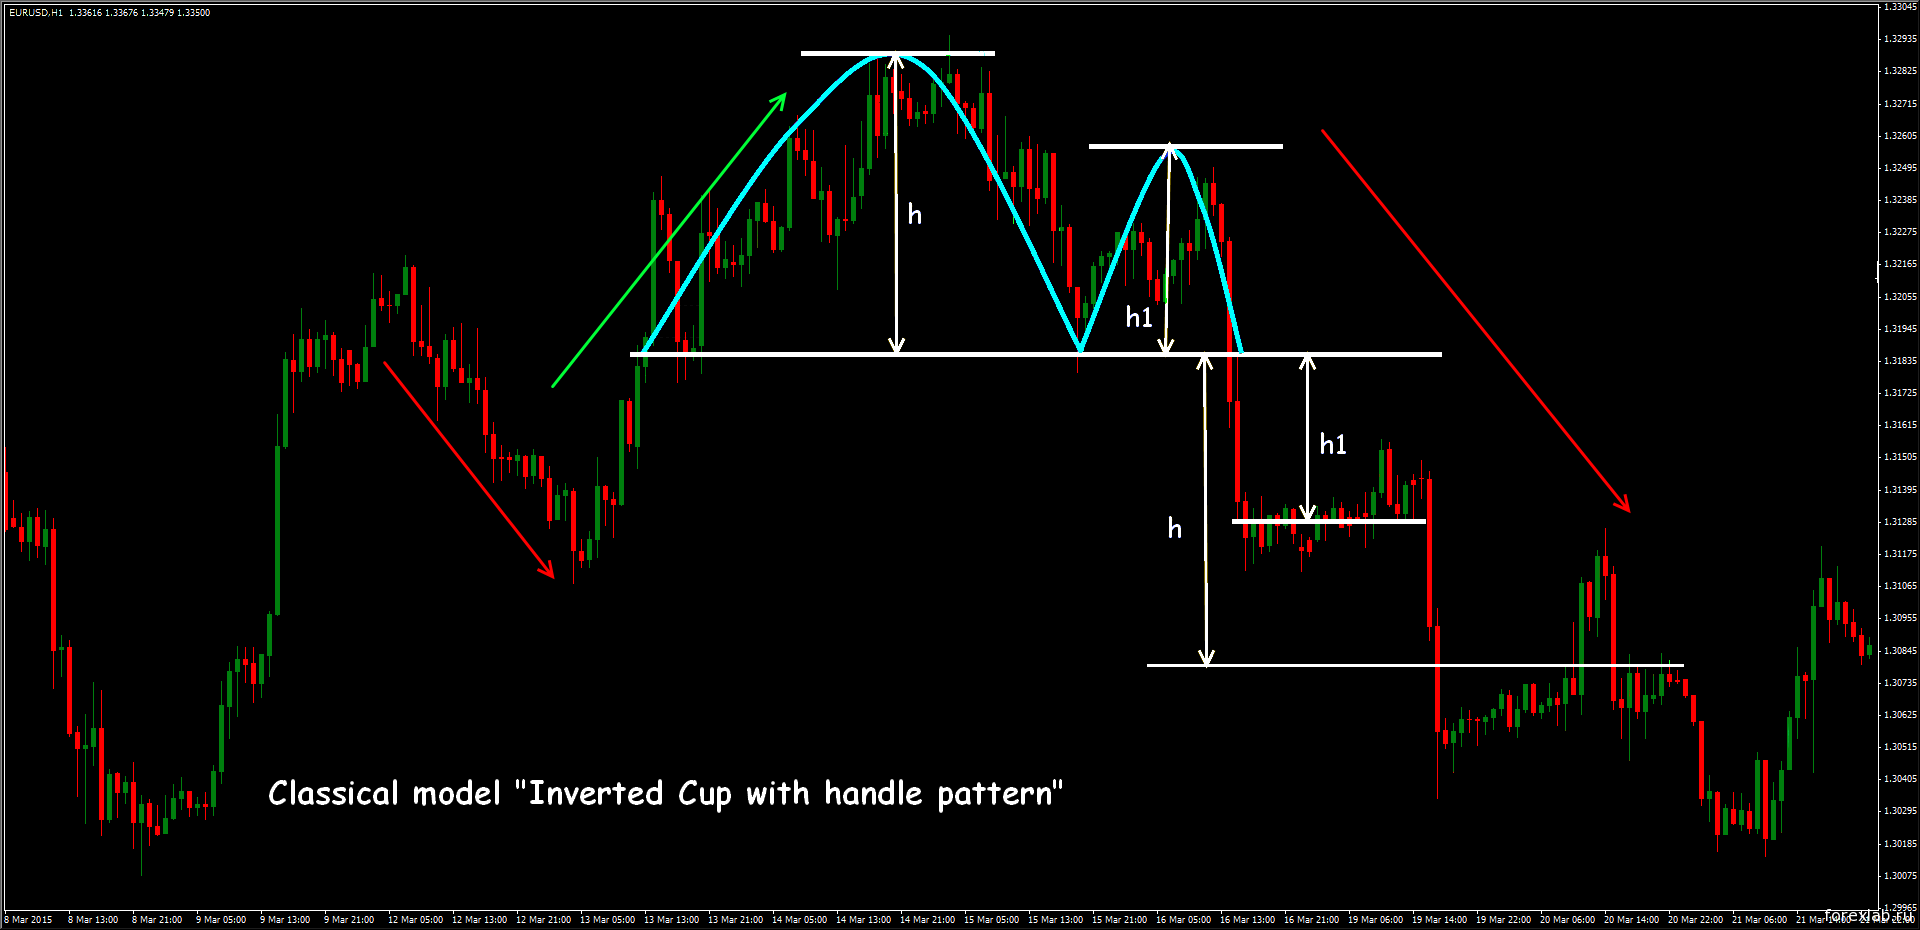
The most popular of round Forex figures has received the name «Bowl» (options − «Glass», «Mug»), more precisely «Cup with handle» and is considered a medium-term trend continuation pattern. The existence of the side graphic site called by «Handle» − is obligatory for such figure. The return pattern on the descending trend has received the name «Inverted Cup with handle pattern», but in the growing market, the main model appears about 3 times more often. Depending on the trend direction the short site appears at the right side of main «Bowl» – for a bull trend, and at the left − for bear.
As well as the majority of the visual analysis figures, ideal «Cup with handle» are formed extremely seldom. Lips of different height, insufficiently smooth «Bottom», insufficiently smooth sides of «Bowl», squared «Handle» or with an inclination against a trend can be created. The more deviations from an ideal, the market effect of the model is weaker, in general.
«Cup with handle» formation market mechanism
Theoretically, weak positions of players against a long trend can be considered as the reason for the emergence of such pattern. That is trade positions in the direction of the main trend are gradually closed, and interest in the opposite direction − still weak. As a result, it is impossible to break the basic direction, the true turn doesn't occur, and after a flat period (uncertainty) the previous trend not only restored but also in addition amplifies. The rest of players against a trend is pushed out from the market after additional correction (the site «Handle») and further, the movement on a trend continues, at least, on the height of all model.
We will consider a typical situation on the ascending trend. The bear correction begins after the growth (the left side of «Cup» is formed), which turns into obvious consolidation in the form of a concave arch («Bottom»). Further, there is the same smooth restoration approximately to a starting point (the right side of «Cup») and the resistance time line is formed. Then there is one more attempt of decrease, but weaker − as a result, one more «Bottom» is formed on the right («Handle»). After the site «Handle» is built completely, the price has to breakthrough the resistance line from below up and return finally to a bull trend.
The bear option of the model («Inverted Cup with handle») is formed by the same way, but in practice, it is considered weaker, as according to the theory of the market psychology, the tendency to mass purchases is much stronger after the long flat period.
The depth of kickback from the main trend is the model height − theoretically it has to be not less than 30% of the previous trend movement. In the real market «Bowl» depth can be from 40% to 70% that quite corresponds to the Dow`s classical theory.
The «Handle» site has to be much smaller than «Cup»: approximately three times less on height and by 5-6 times − on length, but it gives the chance to enter the market before the key breakthrough. The form can be different (a rectangle, a flag, a triangle), and the «Handle» is shorter (by time), the subsequent price throw will be strong. The breakthrough point usually either on the line of the main resistance (lip of «Cup») or on the «Handle» line.
We don't forget to control round models formation conditions on volumes dynamics: if there is no opportunity to see exchange volumes then on the tick data. At the first stage of the model, volume indicators fall until «Bottom» completely isn't created. Volumes grow during formation of the second half of «Cup», the maximum is reached on the resistance line. Further, volumes dynamics repeats during formation of «Handle». The offered scheme has to be carried out strictly, at least, the sharp growth of trade volumes before the «Handle» breakthrough moment − is obligatory. Volume is considered the main tool confirming the validity of round model and signals on an entrance.
«Cup with Handle» figure trade purposes
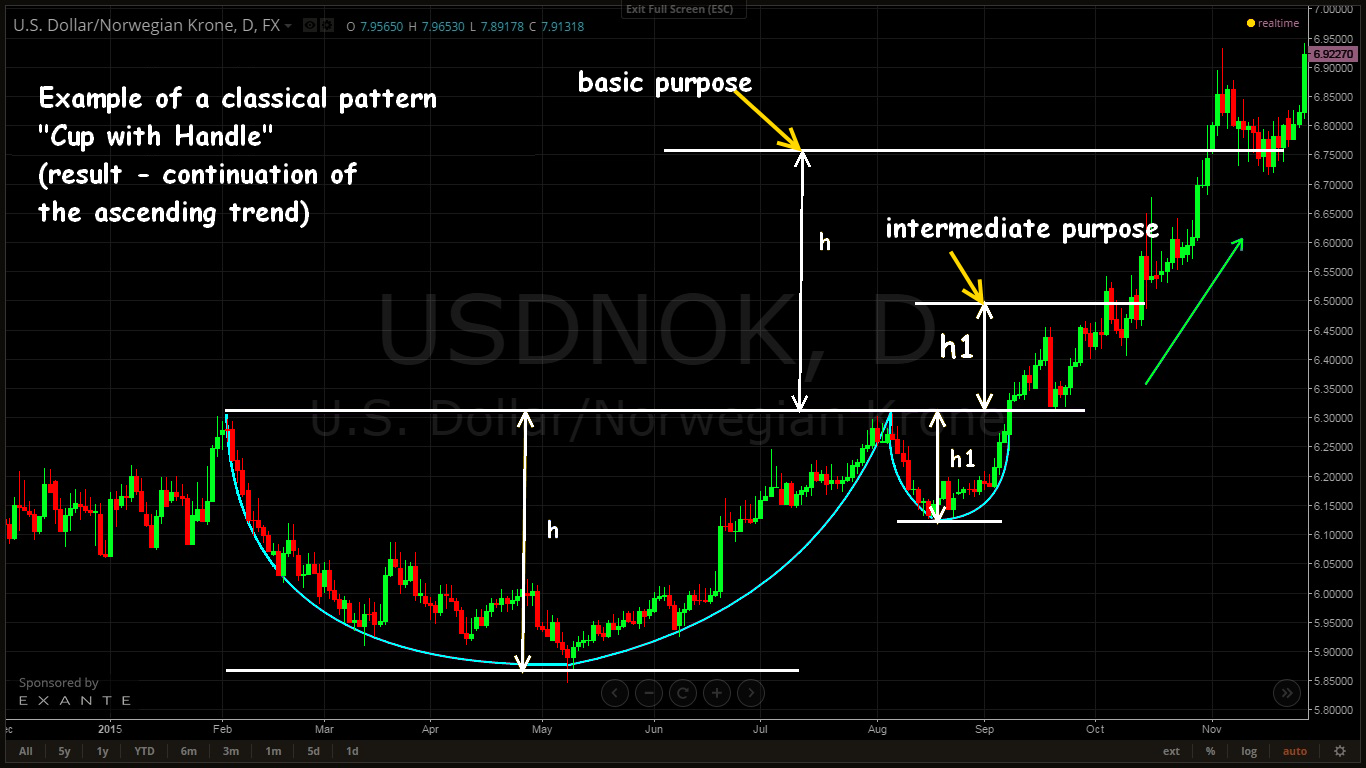
The main price reference point is defined by the «Cup» depth. We will consider the example of a bull model (as a continuation of the ascending trend):
- if the right lip of Cup is below left, then the distance from the right lip to a minimum of «Bottom» will be considered as depth;
- if lips of Cup are created at one level (±5−15 points), then we conduct calculation from the line of resistance to a minimum of «Bottom».
We open the transaction (certainly – on the purchase!) after breakthrough trend «Handle» line (in this case – top) and closings of the current bar higher than it. After breakthrough confirmation, the h level is created either from a breakthrough point or from the right lip of «Bowl». There we place settlement TakeProfit, or, at least, it is possible to fix result partially. The range of «Handle» height (h1) will be the intermediate purpose in the not enough volatile market.
The mirror model is formed on bull correction of the descending trend and as a result of a turn gives signals for sale. Target points are calculated by the same way.
From the point of view of the classical technical analysis, the «Handle» site – typical correction which signals about players residual interest, trying to trade against a trend. It is meant that «The cup with Handle» shouldn't leave from the main direction more than for 70-80%, and «Handle» shouldn't sink more, than for 50% of the right side height of «Cup».
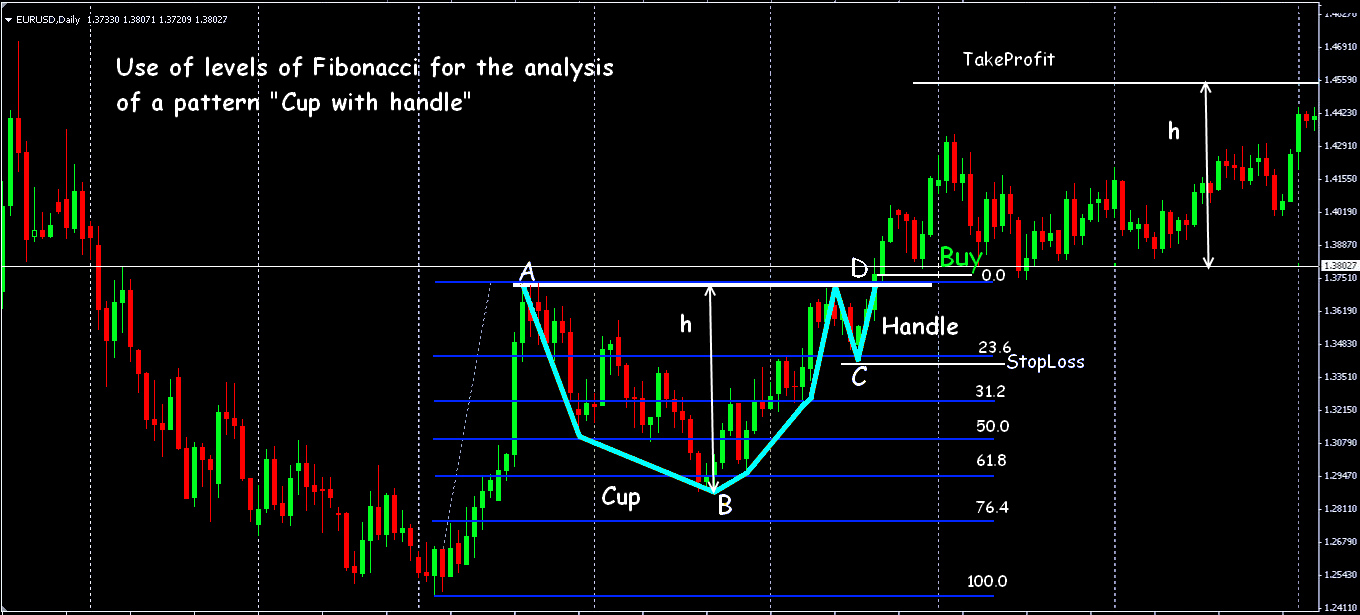
The «Handle» in the form of the Flag model option meets most often (an inclination against the current trend), and in that case, the finishing breakthrough happens below the main lip of the Cup. Then two entry points are possible: in a C point − for aggressive trade and in a D point – for conservative.
The longer site of the Handle means that the price «got hung up» in a correction zone and is going to return to a basic trend by a strong impulse.
«Saucer» round figure
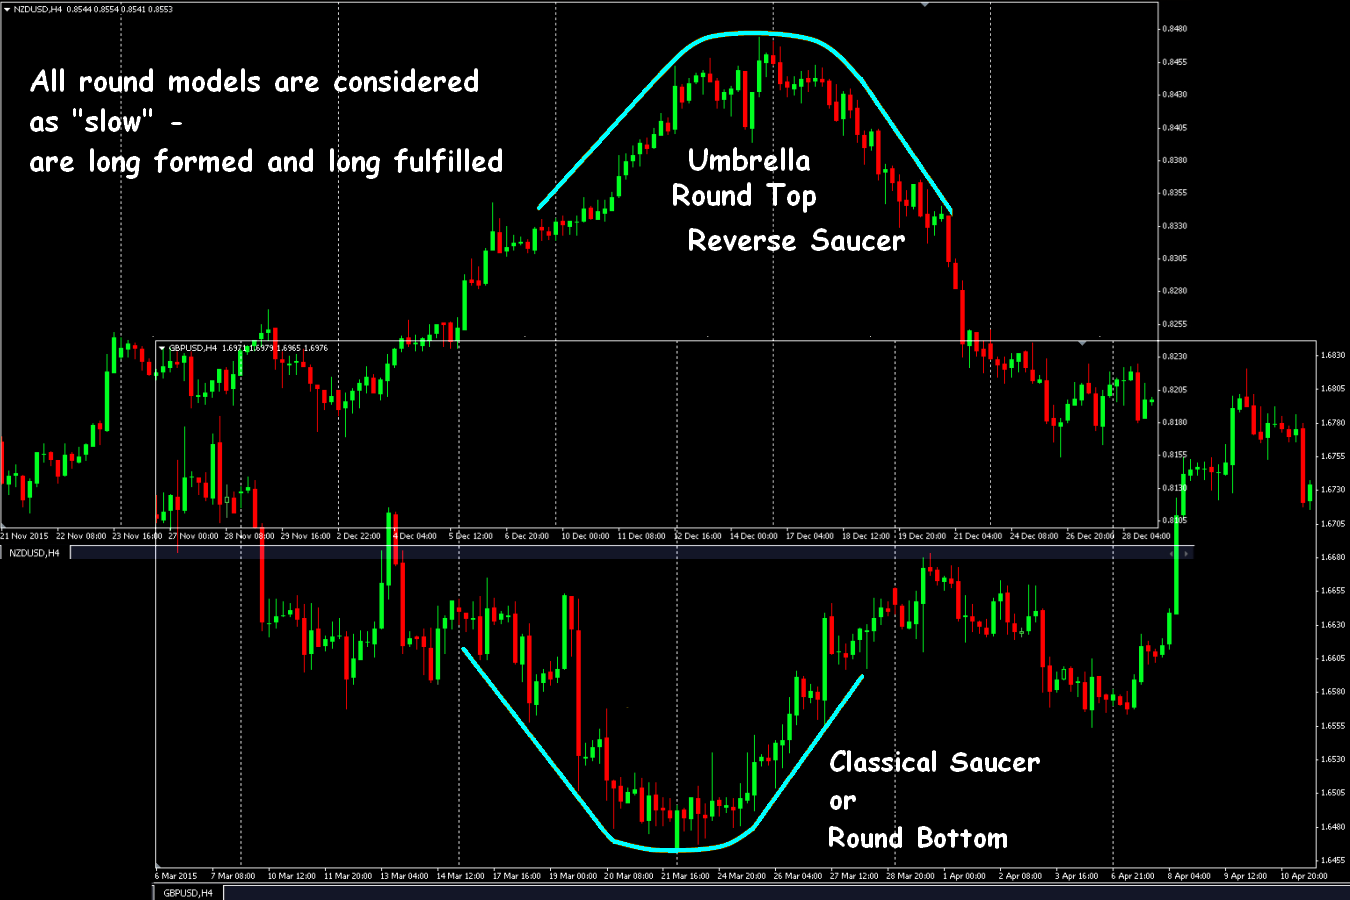
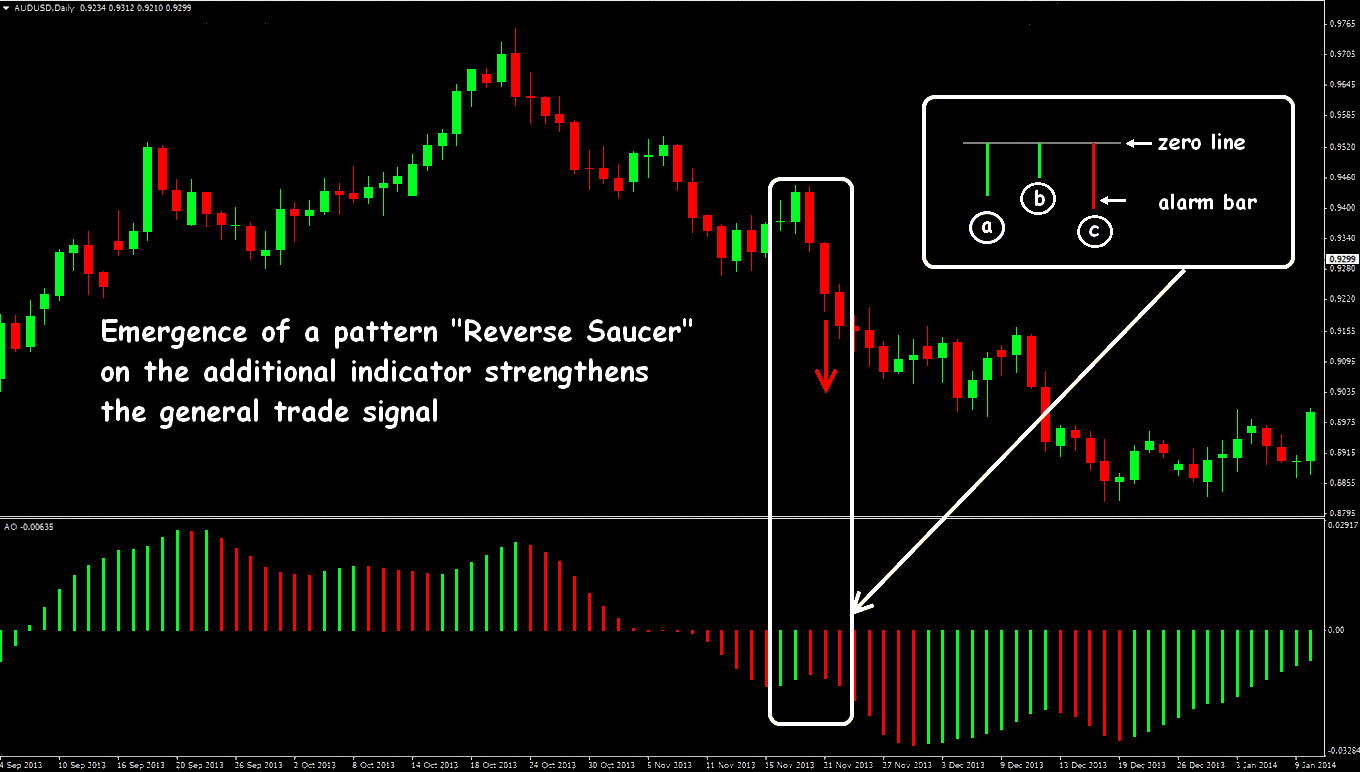
Rare, but very strong turning «Saucer» model (saucer pattern, rounding bottom, saucer bottom) and its return option «Reverse Saucer» (reverse saucer pattern) traditionally please the conservative traders, preferring a long trade. The analysis of big time frames is necessary «to see» this model on the chart, as the figure is rather difficult for identification.
Such model finishes a trend: descending (classical «Saucer» or « Round Bottom») or ascending («Reverse Saucer» or «Round Top»). The full-fledged «Saucer» figure emergence means a reliable turn in the near future and the new direction, at least, for medium-term trade.
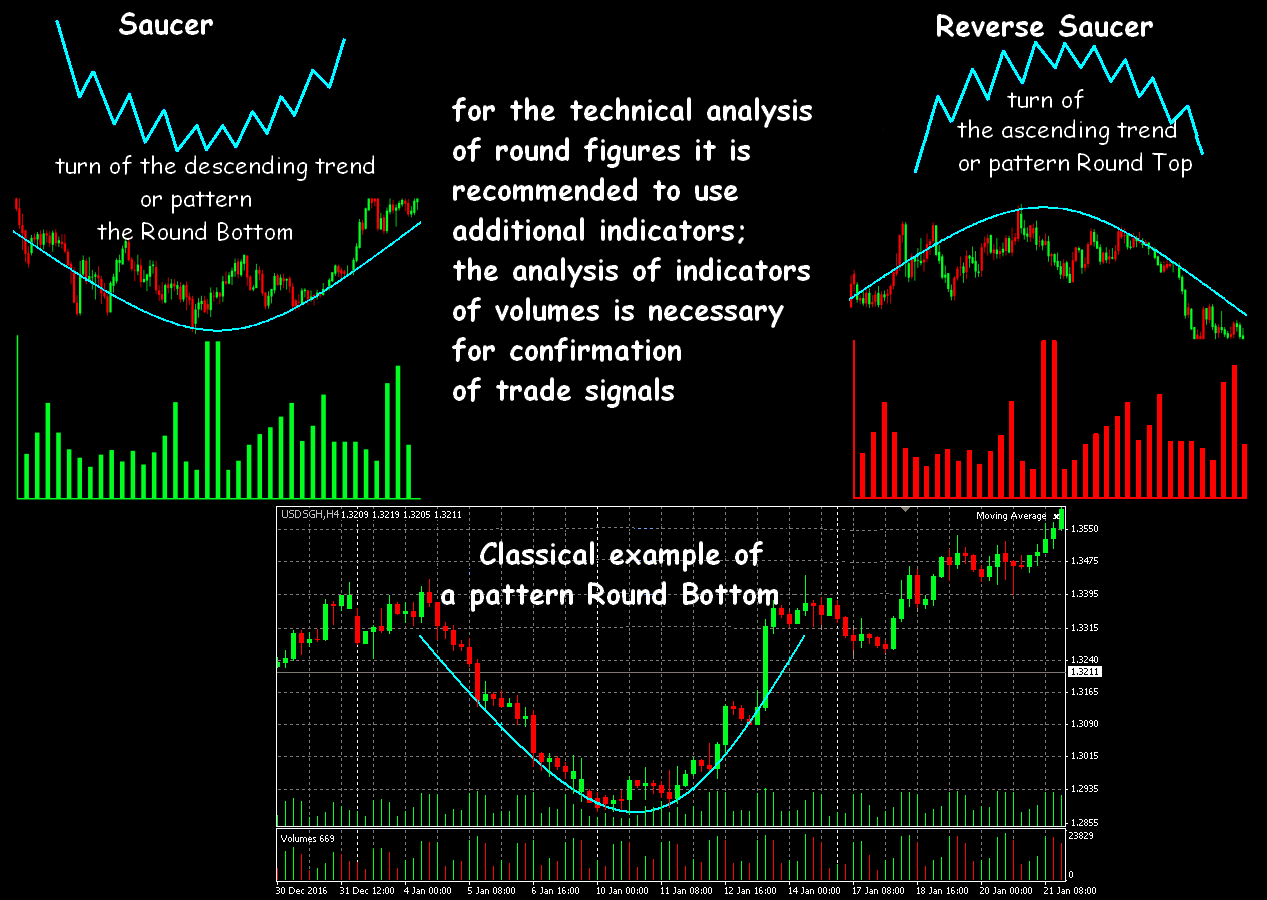
From the point of view of the market theory, the «Saucer» emergence (on a bear trend) means that bears gradually curtail sales, and «bulls» don't hurry to act yet. Because of that, there is a uniform, smooth reduction of price on the first site of the model, then rather long consolidation with small resulting sag and formation of a global minimum follows. Then the players, who have closed positions at the first stage, begin to show gradually interest in transactions in the opposite direction – visually the price begins also smoothly is turning. Such long-term pattern can be formed from 6 months to 1 year, the return movement has approximately the same time stock.
When «Saucer» figure options are forming the price dynamics is followed by the same slow, gradual change of volume: at the extreme prices (max/min) – volume has to be minimum. It is possible to use standard tools of tick volumes to find such model on the chart: if indications of such indicator form a similar pattern – it is possible to prepare for the opening of the transaction.
For «Saucer» («Round Bottom») on the falling trend they allocate the following phases of development:
- Smooth decrease, long enough, with the formation of consecutive local minima.
- The flat site not less than 5-10 settlement periods, and the general minimum of a pattern has to be located approximately in the middle.
- A confirmation signal − breakthrough by the upper bound (of the resistance line) – on the sharp growth of volumes.
- The site of smooth growth symmetric to falling – it allows defining target entry points.
The turn on falling is formed by the same way on the growing trend («Inverted Saucer» or «Round Top»):
- The growth
- Consolidation with the formation of max (approximately in the middle).
- Breakthrough support level, it is desirable with retest (for reliability).
- The symmetric falling of the price.

We check a signal of the correct pattern end on volume dynamics. Breakthrough of a minimum of «Saucer» (a maximum − for «Round Top») is the key moment, which level is called the Line of the Neck.
Several remarks for real Saucer trade
The closest price level of resistance for a classical figure will be the line of the Neck (for inverted – support level), and breakthrough of such bounds will be the beginning of a turn. It is meant that by this moment the trader either has already opened the transaction or, at least, decided accurately on parameters of the postponed order.
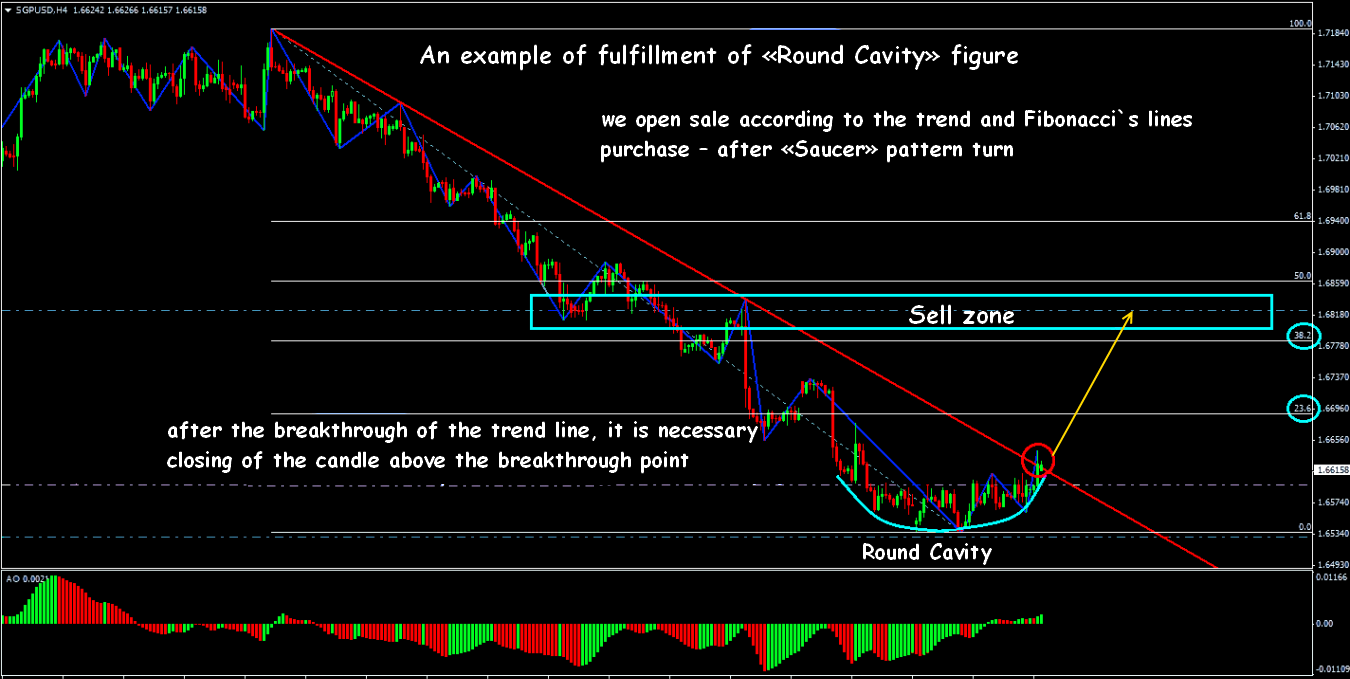
After the breakthrough any trading strategy for a «Saucer» figure assume two options of an entrance – depending on money management conditions:
- Aggressive: just after breakthrough of the Neck − but at the same time there is a high risk «to get» on false breakthrough;
- Conservative: only after a retest of the level of the Neck.
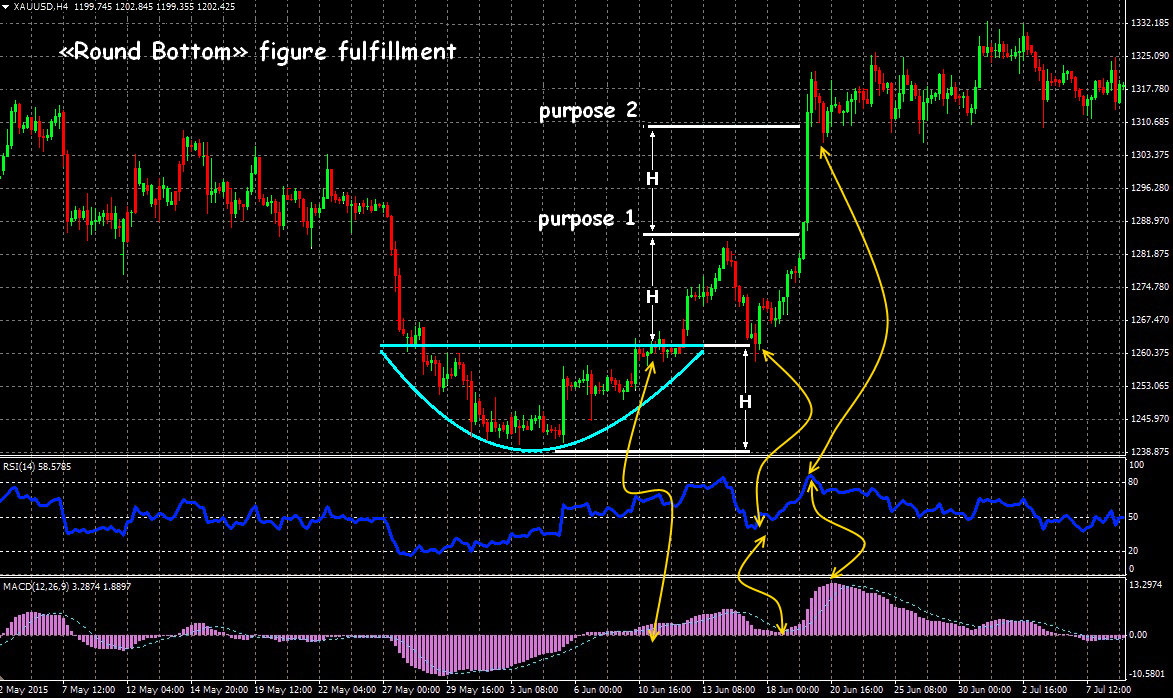
In practice it is very difficult to define an ultimate goal in case of implementation of all versions of a «Saucer» pattern, it is planned that the new trend will be quite long. However, with a high probability, it is possible to expect on two heights levels («depth») of the model. As the maximum StopLoss traditionally are considered min on «Bottom of the Saucer» or max – at top of the inverted figure.
Use of additional indicators simplifies identification of round models. That is you can see, for example, according to the scheme for Inverted Saucer option, when the price still grows, tick volumes already decrease. The price will be developed down after full formation of the model and only then volumes begin to grow, supporting a new trend. In the course of pattern formation in the center of «Bottom» sharp throws on indications of tick volumes are possible.
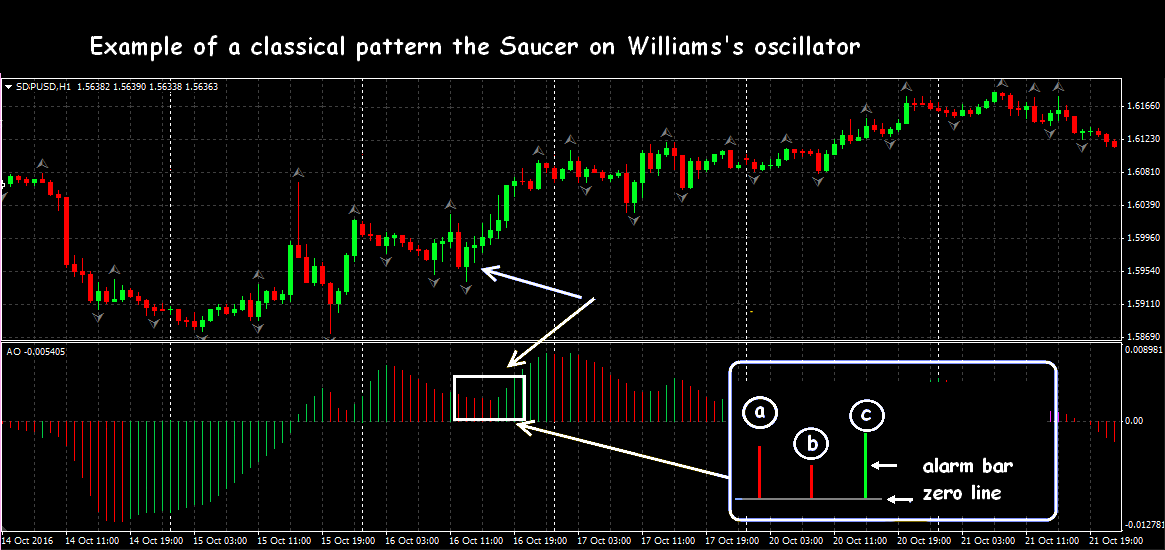
It is considered that the figure of a turn gives a trade signal depending on the position of the oscillator in respect to zero line. For instance, the Round Bottom model generates a signal on the purchase, when the Awesome Oscillator histogram moves above, but only in case if there is a complete construction of a turn on it as shown in the scheme. At least, three next bars of the histogram are necessary for the formation of a signal, as a result of which the trend direction changes.
Several practical remarks
The main condition for the formation of effective round Forex figures is obviously expressed, but an incomplete trend, the price should have rather long «driving distance» after the creation of the «Bottom» site. Otherwise, the trade potential of such constructions sharply decreases. The situation when the round model is completely formed in the middle of the life cycle of the main direction is considered ideal. If the pattern appears in the final phase («before the end of a trend»), then its trade value considerably weakens.
The more ideal the constructed model looks, the «stronger» it is for trade, for instance, the most correct «Cup with Handle» should have max/min at one level (equal lips). The inverted models not only meet much less often, almost are never fulfilled completely.
Special requirements are imposed to «Bottom» − its form has to be U-shaped, evenly semicircular, that means stable consolidation. Then in case of support/resistance key lines breakthrough the subsequent strong trend is almost guaranteed. If the «Bottom» site turns out a V-shaped form or in its middle the double Thorn or a price gap is visible, then you shouldn't consider such construction as round model.
The formation period has the crucial importance for the estimation of round Forex figure: the longer is creating, the stronger. We will tell, on a day time frame «full», the strong «Cup with Handle» is formed not less than three months, and the «Handle» site − from one to several weeks.
All round Forex figures – long term, they should be checked for stability constantly. Usually consistently reduce the analysis period not to miss the hidden tendencies, which capable of breaking the global model. For instance, «The cup with Handle» is well combined with Fibonacci's lines which show levels of possible correction and support/resistance for trade inside a figure.
For installation StopLoss the usual logic is applied to medium-term transactions: on strong price levels or in calculation of a potential loss (on each transaction or on the deposit in general). The sliding StopLoss with a reasonable step − depending on average volatility is actively used.
Round figures always arise during the periods of weak volatility and in the stable market when any speculative fluctuations have to return quickly the asset price in the main range. The trading volume during formation of round figures has to follow accurately the movement of the price (according to the scheme) and its increase in process of end of a pattern is the necessary confirming factor.
If fundamental factors are resulted by such strong price throws that the price doesn't come back to the range necessary to you within 5-10 settlement periods, then it is possible to consider that the round model – is cancelled.
For more reliable calculation the analysis of the general duration of the main trend and the entire period of «Round Bottom» formation is necessary (or «Round Top»): the longer the pattern is created, the strong and long will be the fulfillment of its signals. We analyze surely «quality» of the already created model. Sometimes any smaller, but standard model (for instance, the Triangle or the Flag) may appear on its sites and if volumes behave standardly for such figure at the same time, then such situation can be considered a preliminary signal.
There is no strict rules for the «walls» creation of round Forex figures − the price shouldn't draw an ideal arch, the main thing that local market extrema smoothly moved in the necessary direction.
Time spent for construction has to be approximately identical to each «wall». The «Bottom» site has to be most «flat» and rather long: there are several settlement periods should be before the and after formation of the main extremum of the model (max/min).
After full figure formation (but before key breakthrough!) the market can go for some time again to narrow flat, for instance, in the period of weak volatility because of the fundamental reasons (holidays, weekend). Then there is one more price site in the form of a flat platform. In that case – once again we analyze carefully the volume dynamics for the entire period of construction as the probability of cancellation of the previous calculations is high.
And as the conclusion …
It is possible to identify round Forex figures only if you have sufficient experience, it`s not enough to «see» them, it is necessary to determine the size of the main components correctly.
All market assets form round Forex figures long enough (sometimes − several months), and, therefore, you shouldn't look for such models on the time frames below H4. On futures and stocks, the models on schedules less D1 are considered unstable in the long term. Volatility and speculativeness of currency assets give unstable almost all options on the periods less day, but such models are fulfilled much more often.
In practice, it is possible to analyze correctly all round patterns only in case of the absence of speculative throws, because of they are very «slow», especially it is difficult to see a point of the end of the model on weak volatility. It is necessary to estimate the quality of a price construction in general: duration (and force) of the previous trend and the period of model formation – the more time is spent on its construction, the stronger movement can be expected when fulfilling it.
At the correct identification, the entrance to the transaction on signals of the offered round figures will be profitable on any financial asset, including stocks and binary options. Round models once again confirm popular belief that for a victory over the market the trade capital, first of all, in the form of knowledge and patience, and not just in the form of money is necessary. The reasonable manimendzhment at trade on round figures Forex allows to hold medium-term and long-term transactions even with the small deposit, the main thing – exact calculation and constant control of a situation.
Social button for Joomla