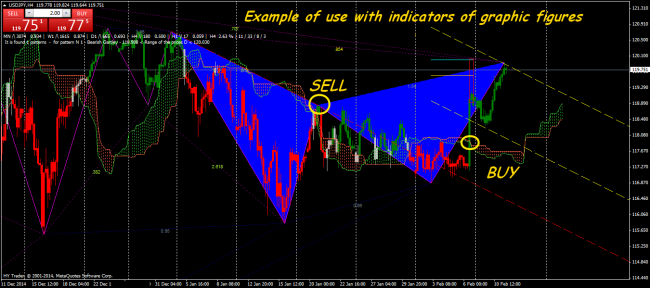
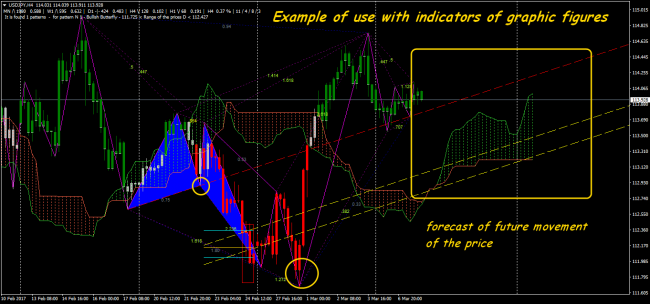
 The optimum combination of indicators is a basis of any profitable strategy for which searches you can spend years. At the same time, the Ichimoku indicator is included in a base pack of all trade platforms. It representing ready to use trade system which can easily be adjusted to any market, if necessary.
The Ichimoku technique uses the unique indicator of the same name created in the country of the first market theory – in Japan in the first half of the 20th century by analyst Hosoda Goichi (a pseudonym − Sanjin Ichimoku). Sometimes it’s possible to meet the complete name − Ichimoku Kinko Hyo. The indicator was created and tested on data on dynamics of the Japanese stock index Nikkei.
However, this means of the technical analysis was provided to the public only in the 60th years of last century as his creator very carefully checked and enhanced the analytical tool. It includes the most balanced mechanism of the analysis of price movement that is why this indicator is called still the indicator of market balance.
All options of Ichimoku strategy are effective in any conditions and practically on all trade assets. They combine benefits of the trend guide with moving averages, and its lines as it isn't surprising, practically match wave 50% kickbacks according to Elliott’s basic theory.
Mathematics and indicator’s settings
The Ichimoku indicator is created by Hosoda for the quickly graphical analysis of a market situation. Visually the Ichimoku Kinko Hyo indicator is five lines which are constructed over a price chart, and also the shaded space between two of them. Three time frames are used for calculations:
- A short time frame – 9 periods;
- An average time frame – 26 periods;
- A long time frame – 52 periods.
Let you be not confused by affected Japanese names – calculations of lines are rather simple.
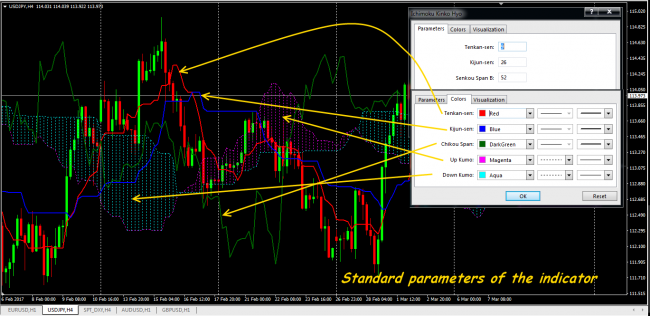
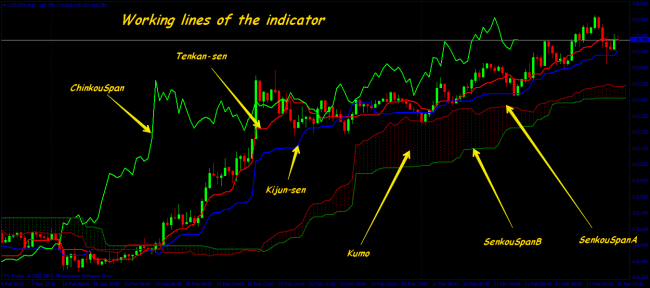
Tenkan-sen, or Tenkan − the line of a «turn», basic color – red. The line of a short trend, regular average (a half of the sum of High + Low) for the first interval of averaging, by default – 9. The trend guide, the more a tilt angle, the stronger direction. As the regular moving average, performs support/resistance function.
Kijun–sen, or Kijun − the line of «standard», basic color − blue. The average line is on the second interval, by default – 26. A more reliable indicator of a trend. If the price is higher than the line – further growth is supposed, below – a fall. A release from this line – rather strong signal to enter.
SenkouSpanA, or Senkou A – the upper (first) «future» line, basic color – different shades of red. Its value – in the middle of Tenkan/Kijun range, but displaced forward on the size of the 2nd time frame.
SenkouSpanB, or Senkou B – the lower (second) «advancing» line, basic color – various shades of green. The average line for the biggest interval shifted forward on the size of the 2nd time frame. By default – 52.
The space between SenkouA and SenkouB is shaded in different colors, depending on a relative positioning of lines, forming graphical «Cloud» (Kumo). When the price inside of Cloud – the market is flat, and borders are as strong lines of resistance. If the price is higher than a cloud − the bull market, below – bear.
ChinkouSpan – the «late» line showing the closing price of a candle, which is remote from the current one on the size of the second time frame.
Substantially all lines of the Indicator are an average price value for a certain period of time, that is − an analog of moving averages, so a trend is directed in the way where lines are moving to, and horizontal lines will mean a flat. Ichimoku levels are dynamic, the emergence of new price peaks and hollows involves instant reorganization of all graphical picture.
There is a set of options of use of Ichimoku lines within the creation of trade system. The specified parameters are classical, experiments with time frames and the periods of the indicator allow to find optimum configurations which will correspond to the individual style of trade for each trader.
Ichimoku strategy application in real trade
Parameters for the system have basic setup on the stock market which market cycle is equal 1 year. The idea of the indicator’s author (it still call Hosoda's logic) was that the first parameter – the line Tenkan shows an average price value for 9 days (one and a half business weeks). The second parameter Kijun − 26, this number of the working days in a month as in Japan there were 6 working days a week during that period. The third parameter – the size 52, this number of days in two working months, determines Senkou Span B value.
Considering the above, how rational to use classical parameters now? If to consider that nowaday trade week constitutes 5 days, and, respectively, there are less trading days in a month. Then it is logical for trade on schedules of Daily (and less) try to correct indicator parameters under modern trade week in 5 days. We receive Tenkan for D − 8 (or 7), or one and a half business weeks, 22 – number of the working days in a month (on average), and 42 – the period in two working months.
Following Hosoda's logic, it is possible to calculate parameters and for other time frames. It turns out that basic settings are adjusted for work on week candles, but also intra-day, in case of small correction towards the equivalent reduction of parameters, the system gives excellent signals and gets off only at the moments of the speculative market, for instance, after the news.
Important: the last argument in case of work on Ichimoku strategy is always the ChinkouSpan line: if this line is higher than the price in case of any BUY signal, then this is an additional confirmation of a trading signal. Any signal in SELL will be more reliable if the ChinkouSpan line is lower than the priceat the time of an enter.
The basic purpose of Ichimoku indicator lines is rendering support/resistance to price movement. A number of lines are «stronger» as reflecting a mid-term trend on the chart - it is Kijun and Chinkou B. Lines of a short-term trend Tenkan and Chinkou A are less steady and are more easily stitched by the price. Any Ichimoku strategy includes several tactics with an individual set of trading signals. The interval – from H1 above, D1 is the best.
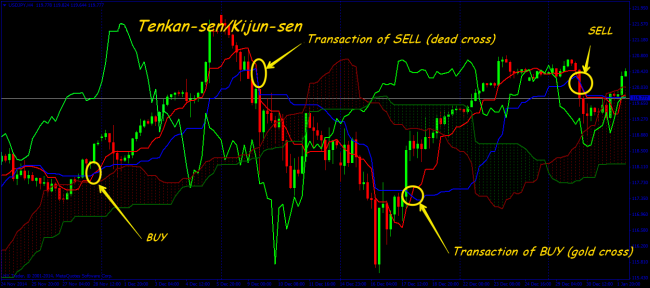
Tactics 1. Tenkan-sen/Kijun-sen crossing
Bull signal: Tenkan passes Kijun from below up, forming a «gold cross» figure.
Bear signal: Tenkan crosses Kijun line from top to down, forming a «dead cross».
Signals arise in points of intersection of the specified lines, but they need to be analyzed from the point of view of an overall picture of constructions. For assessment of force of a signal the following recommendations are used:
A Strong signal Tenkan/Kijun: for purchase – crossing shall be above Cloud border, for sale − the point of intersection is under the lower bound.
The neutral signal Tenkan/Kijun for purchase and for sale: crossing is in the Cloud.
A weak signal Tenkan/Kijun: for purchase – crossing is under the lower bound of Kumo, for sale – over the upper bound.
Entrance: the order is opened in the direction of a point of crossing after closing of the previous candle. Stop-loss: behind opposite Kumo bounder or according to rules of management of the capital. Exit: at the return crossing of lines or on a take-profit.
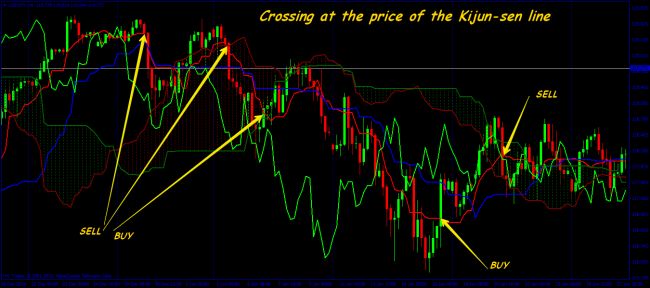
Tactics 2. Crossing of Kijun-sen by the price
One of the most reliable signals of Ichimoku trade strategy. The technique works well on all the time frames, but on intra-day is less reliable.
The bull signal Kijun: breakthrough by the price from below up, closing − behind the line.
The bear signal Kijun: breakthrough by the price from top to down with fixing behind the line.
Strong signals: bull − crossing is above Kumo's bounder, bear – behind the lower bound of the Cloud. Neutral signals for purchase/sale: crossing between Cloud bounders.
Weak signals: bull crossing – below the lower bound, bear – above the upper bound. Check through Chinkou Span – is recommended.
Entrance: the order is opened after a crossing point on a trend, but only after fixing of the previous candle. We track an arrangement of strong levels of support/resistance.
Stop-loss: 5-10 points from the Kijun line on the opposite side (over or under the line). Further, you may move a stop through creation Kijun line, keeping a gap in 10 points.
Exit: on the return crossing at the price of the Kijun line or by rules of a money management.
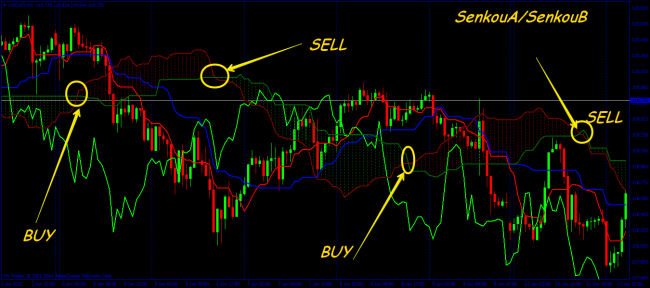
Tactics 3. SenkouA/SenkouB crossing
According to Ichimoku strategy − it is a signal of a probable turn of a trend or kickback towards the SenkouA line. If SenkouA is crossed by SenkouB from top to down and it is confirmed by a change of color of the Cloud − purchase, in the opposite option – sale. Reliability of this tactics decreases because the SenkouA and Senk lines are constructed expecting «future movement», and the current price is removed for 26 periods from the crossing of lines.
We can discuss the uniqueness of Ichimoku indicator infinitely − this is the universal assistant capable of carrying out the variety of tasks. The main functions are: identification of market trends, determination of key lines of support and resistance, the creation of signals for the opening of positions. Ichimoku indicator is best for day and week schedules.
Practical example: KumoBreakout indicator strategy
The simplified system on the Ichimoku indicator combining benefits of the well-known Japanese technique with the standard oscillator and the smoothing effect of Heiken Ashi candles. Incorporates all necessary tools: trend, pulse and the forecast of future movement, and at the same time doesn't overload a price chart with excessive information and graphical creations. The technique is profitable on any tool, including − on an unstable trend.
The system doesn't use price lines with difficult names and works only with Kumo graphical creations of (Cloud) among all Ichimoku tools. A technique essence – use of unique properties of KumoBreakout effect (or breakthrough of Cloud bounds), and Ichimoku missing properties are compensated by additional tools.
Strategy with «cut off» Ichimoku complete with the oscillator for the first time was applied by the famous Swedish trader and the analyst Larsson to trade in binary options − profitability of its signals reached 80%. Subsequently, the accuracy of the fulfillment of a trend inherent in strategy and a capability to forecasting began to be used successfully on Forex.
Adjusting of indicators and principles of KumoBreakout strategy
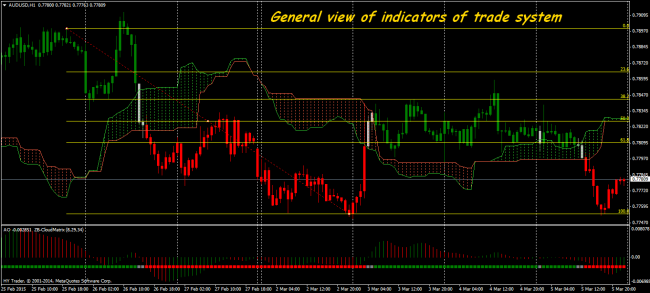
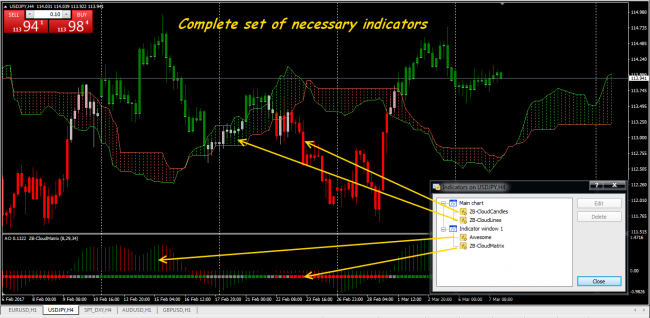
The template containing three unique indicators along with standard AwesomeOscillator which is installed by a standard method in the basic MetaTrader4 (5) catalog is used.
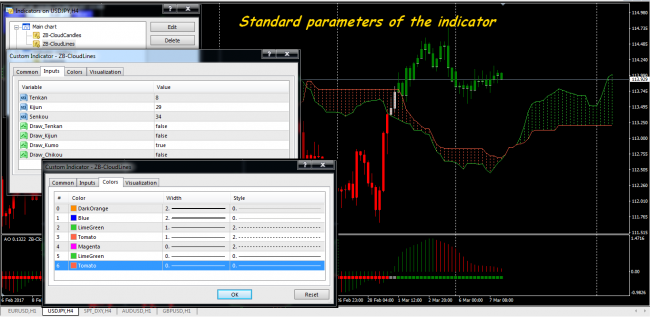
The Kumo cloud builds the ZB-CloudLines indicator – it is recommended to keep the offered standard parameters and color scale.
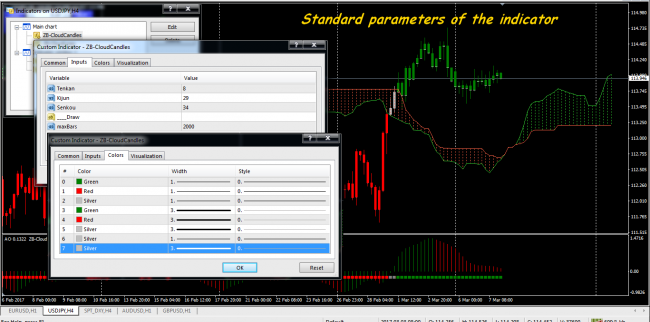
The ZB-CloudCandels indicator is responsible for the correct display of price candles according to the current trend and logic of the system.
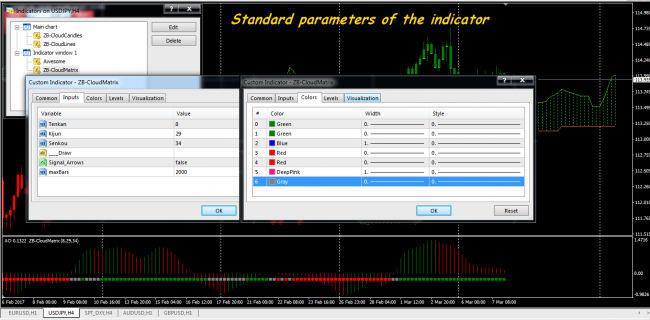
The standard AwesomeOscillator indicator along with the ZB-CloudMatrix indicator of the direction of a trend is placed in the lower window.
It should be noted the KumoBreakout indicator system has a harmonious red-green color scale by default – nothing extra. The main Cloud which configuration and an arrangement determines availability and the direction of the main trend is constructed on a price chart. HeikenAshi candles smooth the schedule and highlight with color the main tendency.
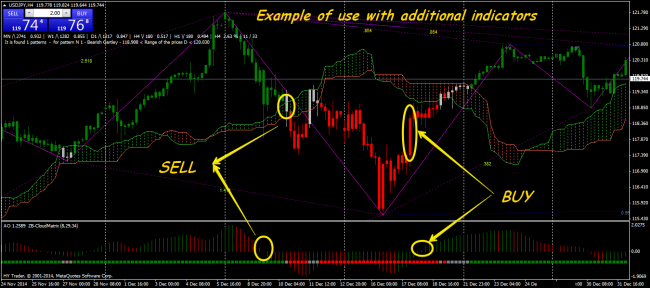
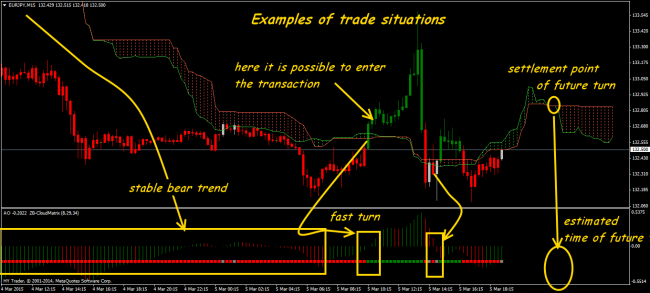
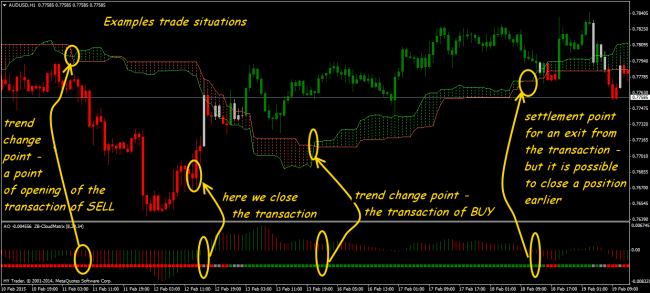
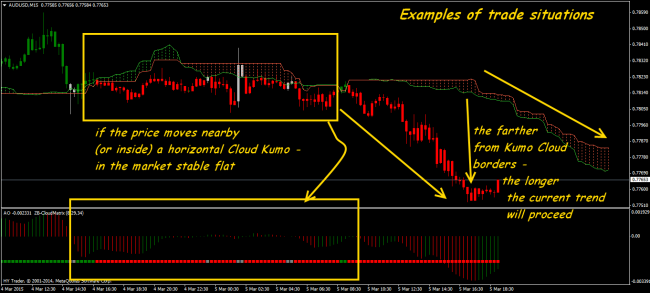
The key concept of this indicator strategy – «Kumo's breakthrough», that is a break of the price for the upper or lower bound of the Cloud. Breakthrough of the upper bound means a tendency to growth (purchase), of the lower bound – to fall (sale). The dot indicator which confirms a signal on an entrance by the corresponding color works in an additional window: green – a bull trend, red – bear and gray – the periods of a flat. Change of color warns about a change of a trend.
Important: in case of creation the «steps» of the Cloud rather precisely show turning price levels which in general match a basic Fibonacci’s grid.
Application of KumoBreakout in trade practice
It is possible to apply strategy on any tool, but really steady results are yielded by middle volatile currency pairs: EUR/USD, GBP/USD, AUD/USD, USD/CAD, USD/CHF. Futures yield results only on the periods from D1 above. Cross-pairs for this technique isn't recommended because of big dependence on fundamental factors.
Recommended time frame: for the search of a point of entry − M15, for holding of the transaction – from H1 above.
Trade time: European and American sessions. We don't trade before and after the news.–It can be not enough volatility for short-term transactions in a night session, the system tracks a general trend reliably.
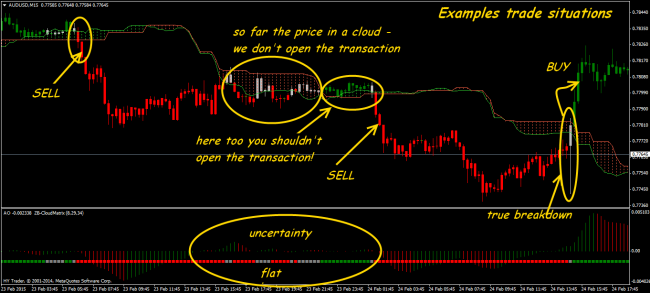
So, the KumoBreakout indicator strategy gives a signal for position opening on purchase (Buy) if:
- The price punches the upper Kumo bound from below up down, the candle is closed above the bound and changes color for green.
- The dot ZB-CloudMatrix indicator in the lower window of the schedule shall be green.
- The oscillator gives a standard signal on a bull trend – crossing the zero line or change of the histogram direction to movement up.
Entrance – at the opening of the following candle. While the price is above the Kumo upper bound– the bull trend remains, and the farther from bound – the stronger.
Conditions for position opening for sale (Sell):
- The price punches the Kumo lower bound from top to down, the candle is closed below the bound and changes color for red.
- The dot ZB-CloudMatrix indicator shall be red.
- The oscillator gives a standard signal on a bear trend – crossing the zero line or change of histogram movement of the oscillator to movement down.
Entrance – at the beginning of the following candle. According to the logic of KumoBreakout strategy: until the price is under the Kumo lower bound – bears prevail, and the more a distance to the line – the trend is stronger. We put StopLoss/TakeProfit proceeding from the principles of admissible risk or at the strong price levels.
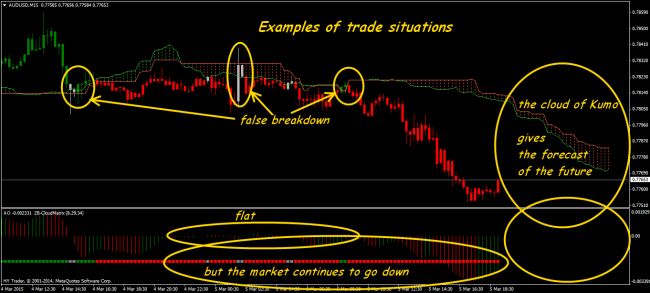
Flat sites of the market are visible in the direction of the Cloud: during the uncertainty periods, it is located horizontally. If candles keep the last color at the same time, then the trend will proceed with a high probability.
Important: the trend weakens in process of approach of the price to Cloud bounds. «Width» and a configuration of the Kumo area depends on the current volatility of the trade tool.
Important: according to this system we don't open a position while the price is in the Kumo area (a candle and/or the dot ZB-CloudMatrix indicator has gray color).
The emergence of «false» breaks is possible when the dot indicator shows several gray points (on a price chart – several gray candles) then color changes on previous and the general direction of a trend remains.
As well as the Ichimoku standard indicator, ZB-CloudLines gives a certain forecast – builds «future» Cloud proceeding from the standard assessment of a market situation. It approximately determines a possible configuration of movement and price levels of a possible turn. In case of change of a situation, «future» Cloud is reconstructed, moving on new levels.
It is possible even to approximately predict possible time of a turn on the availability of «steps» on already «fulfilled» Cloud and approximate price levels of a turn or consolidation. The point of intersection of bounds of «future» Cloud quite precisely shows moment where the trend can change with a high probability.
Important: taking into account admissible risk level it is possible to use entrances after speculative «quickly» price breakthroughs of bounds of the Cloud for short-term transactions.
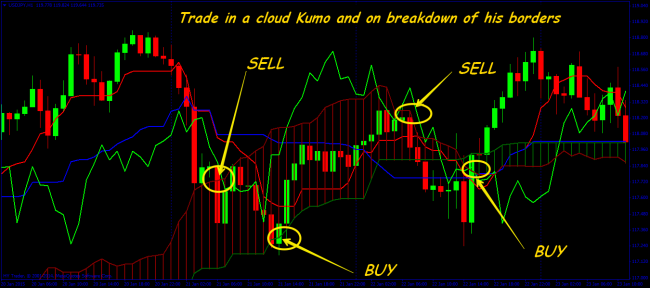
The space of the Cloud can be rather big, therefore, trade inside of it and on a release from its bounds is possible too, but it is the weakest tactics in a set.
If the overall picture is favorable, then we work only for the breakthrough: a purchase signal − closing of a candle over the upper bound, a sale signal – closing under the lower bound.
If the purchase is opened inside the Cloud, then stop − behind its lower bound, if sale – behind the upper bound. Take-profit − opposite bound of the Cloud (from 20% to 120% of Cloud space).
It is necessary to consider «Kumo's mood», let’s imagine the cloud is painted in «bear» color, then this is an additional confirmation of a signal down. If the color of the Cloud contradicts your intentions – better to wait.
And as the conclusion …
The long-term statistics of trading shows that trade strategy based on the Ichimoku indicator practically don't yield negative results. Traditionally all techniques give profit in the quiet, not speculative market and medium-term transactions. Standard Ichimoku strategy doesn't have additional indicators because its mechanism was developed for work with the stock exchange indexes, but to fans of short-term trade is strongly recommended to add indicators of amounts (for example, awesome). Experience shows that use of the additional oscillator gives a set of reliable signals practically on any period. It means – it is possible not only scalping effectively but also to hold open positions for several hours, as much as possible fulfilling possibilities of the current trend.
The external complexity of Ichimoku graphical creations usually frightens off beginners, but that persistent who will spend time for its development, it gives stable profit on any asset. Studying of this strategy requires a lot of time, but the result is worth it: in case of careful setup efficiency of the generated signals reaches 80%. Besides, understanding of the logic of the Ichimoku indicator – it is stylishly, modern and professional for any trader.
Social button for Joomla


