

")
 There are the market`s laws which will earn a profit at any time and on any asset. Any trader dreams to see in the market the thing, that no one of the crowd sees, but also the considerable courage is necessary to do the necessary actions in time. The Murrey`s levels were created for those who wants to be actual and strong.
The zones of «accumulation» of trade interest or price levels are always considered as a reliable technique for market estimation. Murrey`s price levels are used quite seldom by the beginning traders because of an external complication of the indicator, but after you gain insight on his technique it`s possible substantially increase the effectiveness practically any trading system.
The classics of technical analysis regards there are always two news in the market – bad and good. Bad: it`s impossible to predict the market. Good: to earn – it`s not necessary. Thomas Henning Murrey was convinced that serious trader particularly works in the market, therefore clearly knows the strategy of its trade even before receiving the respective signal. The main Murrey`s achievement is the creation of the fractal geometric scheme for a description of price movement in time, which allows increasing the trader`s chances to be on «correct» side of the market and, the most important, to leave the market timely.
The Murrey Math Trading System – is the classical and rather successful implementation of the basic market principle «the price takes into account everything», which predicts the behavior of crowd with the high chances. Because of that the system similarly successful in the market of shares, futures, currencies and options. It is a practical adaptation of the difficult for perception Gann`s theory, but herewith also considers successful preliminary studies of Elliot, Williams and Demark – the followers of mathematical market theory.
Fractals and Squares «Price-Time»
The clear understanding of the fractal`s concept is required for trade according to the principle of Murrey`s levels – Gann was among the first to support the idea of fractal nature of market prices. In his theory («square law characteristic of price and time») the general price movement, which is necessary for estimation, was divisible by 8, and the angle of movement with regard to the trend line was estimated further. For instance, the movement at an angle of 45° was considered as strong, and deviation (correction) by 50% of extremum – the most important. Fibonacci`s technique, besides, «think» in the same way. However, in practice, the Gann`s square looked too complicated and requiring to the regard of accompanying factors (for instance, moon phases or configuration of essential constellations) and kept unavailable for mainstream use. The Murrey`s mathematics simplified this idea significantly.
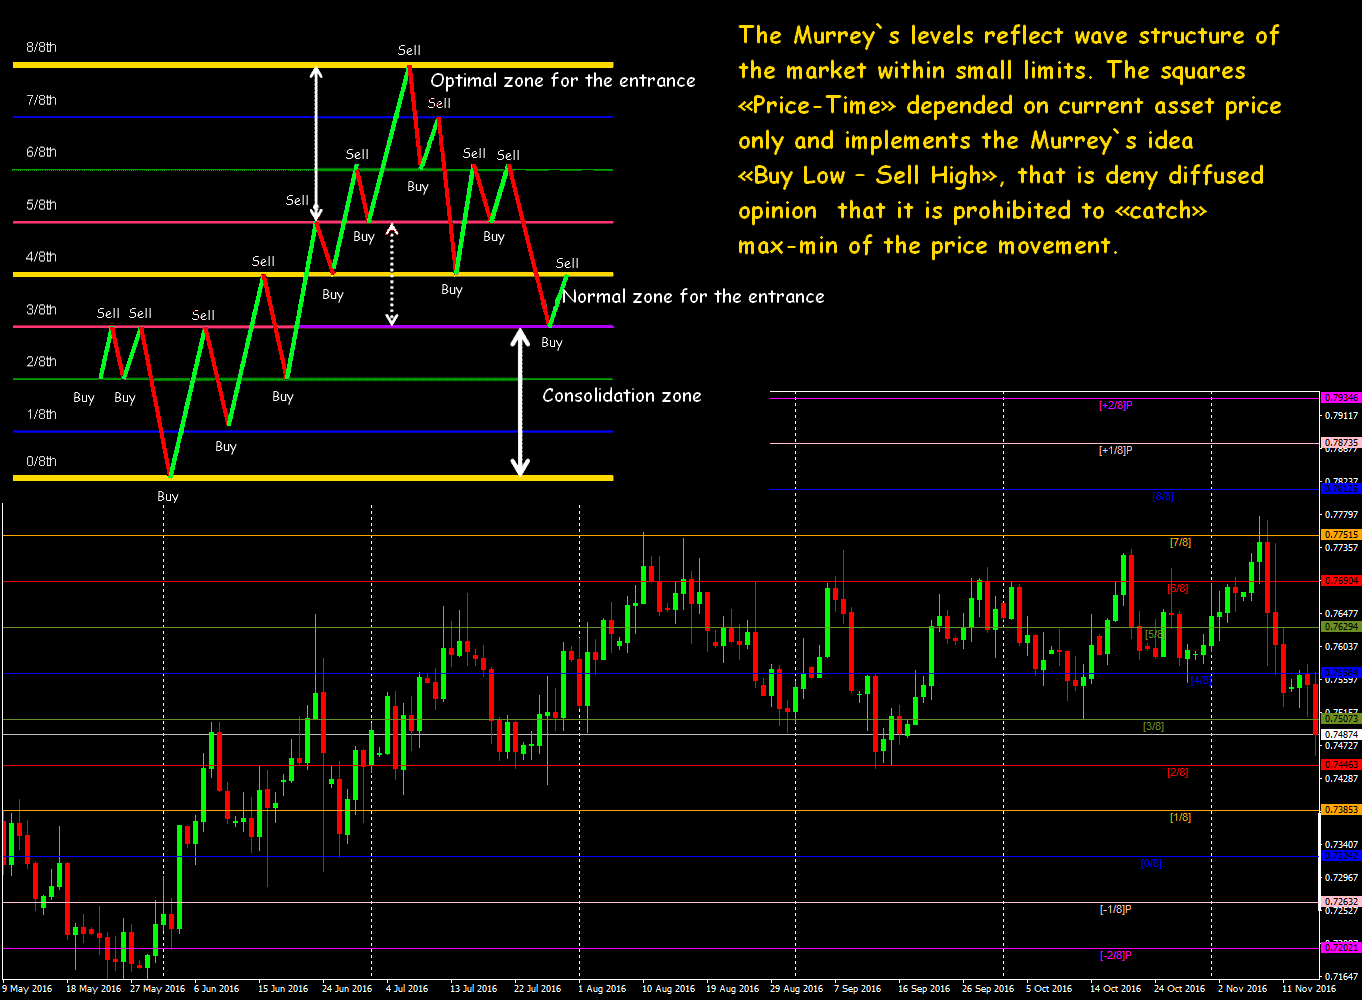
From the point of view of practical trade, the square «Price-Time» is represented neither more nor less than fractal, which can be zoomed from a bigger square. The minimal square is equal to minimal price movement, which you are ready to control – Murrey called it by «rhythm» of market definition.
Gann divided the price range by 8 intervals (from max to min) because he thought that after single movement there must be a breakthrough or kickback to one of the levels [1/8], [2/8], [3/8], [4/8], [5/8], [6/8], [7/8], [8/8]. According to his theory, it was necessary to watch all movements and to choose the most «significant». Because of this Murrey produced his package of 9 key lines (main, basic, inferior) and 8 intervals, which was called the Octave later. There are lines below which were constructed automatically by an indicator showing their main meaning:

Smaller Octave is constructed by the same technique
Time and Murrey`s levels
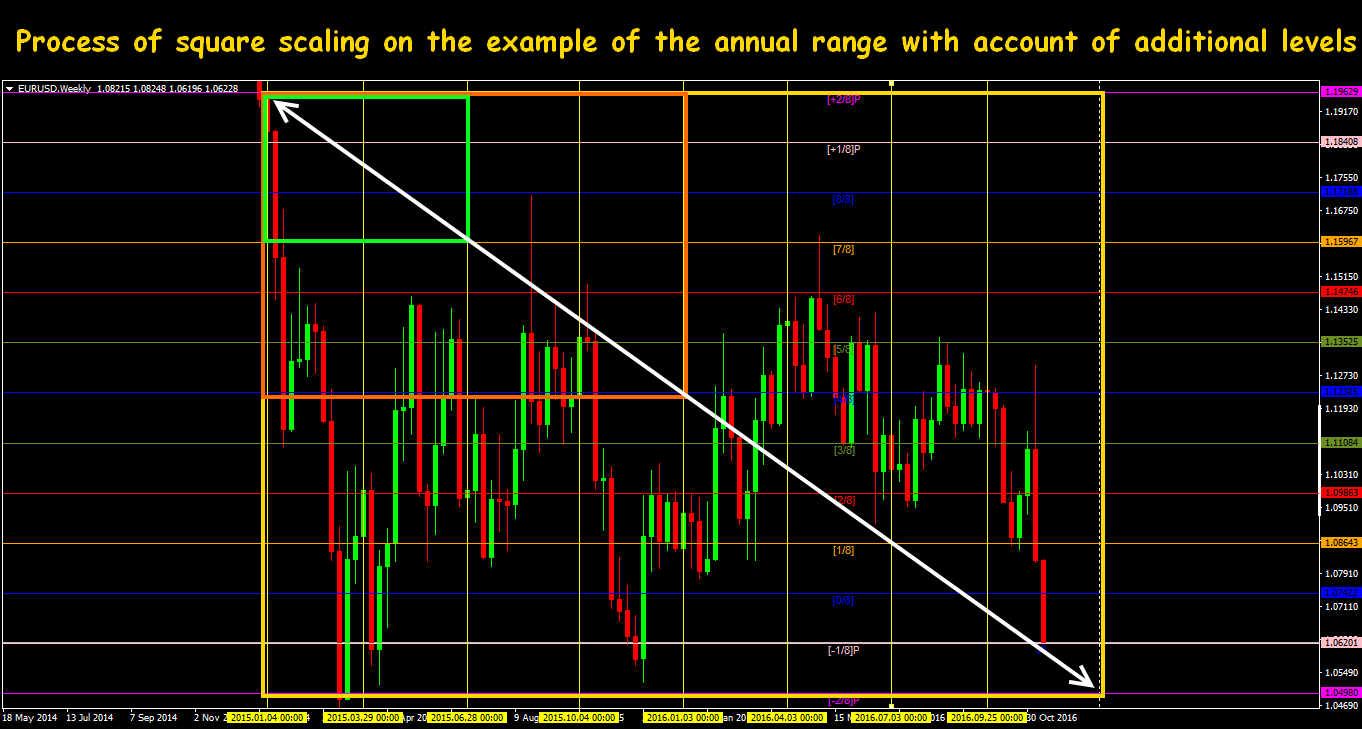
Price gives to Square «Price-Time» a vertical scale, now it`s necessary to be determined with horizontal. Iy is considered to be that there are 52 full weeks at the calendar year, that is 5*52=260 trading days, as the square 8x8 is on the basis of Gann`s theory, then we approximate the number of days to 256 or 4 quarters containing 64 trade days each. Such scheme allows easily scaling calculation for market estimation. The square works as a system of coordinates and if the price creates a new extremum, the scale of Square proportionally increases/decreases. By the way, the world economy measures the time by quarters too, each of which is divided by separate seasons with weather states. According to Murrey the zero point for new Square is the beginning of the year, which was opening at the first week of October by the first quarter auctions on American treasury bonds.
The choice of time frame is the key point and shall give more or less clear answer how long the price was traded in the certain range. The initial point – an annual Square, further everyone reduces the scale to most applicable to certain trade system. Recalculation of Square (Octave) is carried out when the price turns after a strong trend.
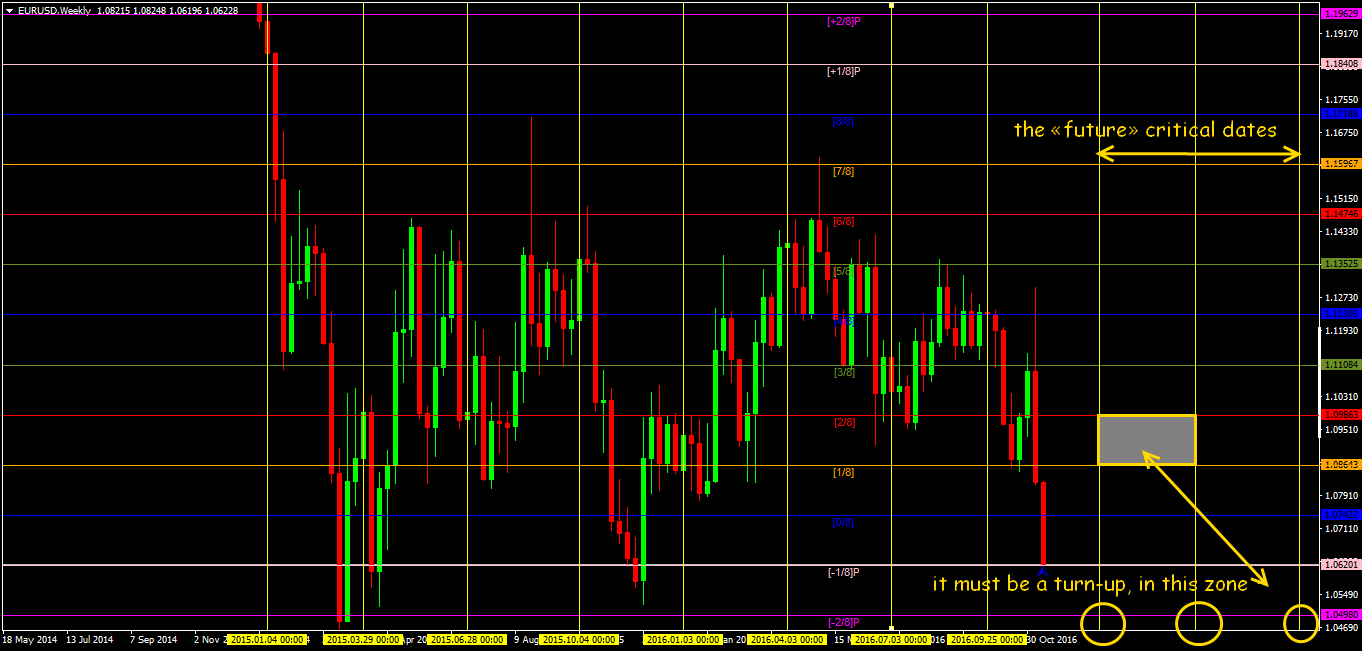
If the horizontal (price) Square side acts as levels of support/resistance, the vertical sides, rather its dates shows the reversal points of a trend in time (according to Murrey – on the level [1/8] of the general period). That is Murrey`s technique shall settle the main trade question: when the turn will happen, which is calculated mathematically upon price history.
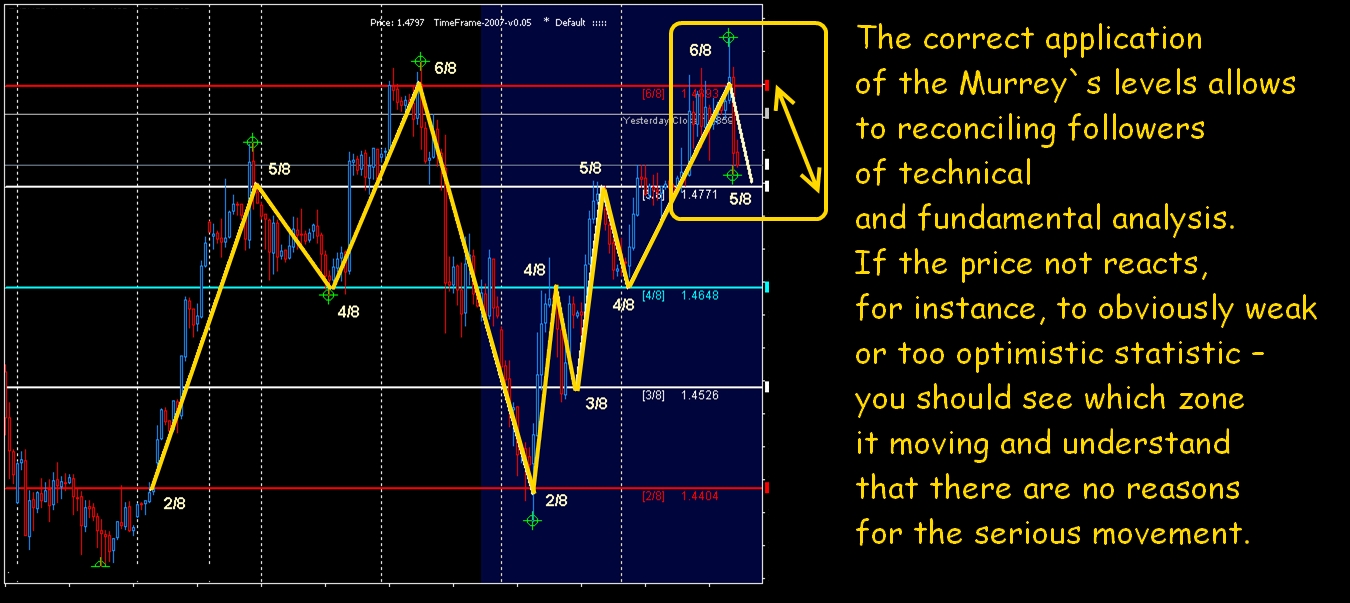
Along with any time estimation, the calculation upon Murrey suffers from the main problem – it doesn`t consider the influence of the basis, the reaction to which not always may be described by the theory of market crowd behavior. Of course, if the market moves without obvious speculations (corresponds to the technical analysis) and according to the time it approaches to the moment of turn according to Murrey, then it`s quite possible to include this prevenient signal into the analysis.
The parameters, settings and properties of the levels
That goes without saying today the Murrey`s levels is calculated and constructed automatically, by means of various indicators.
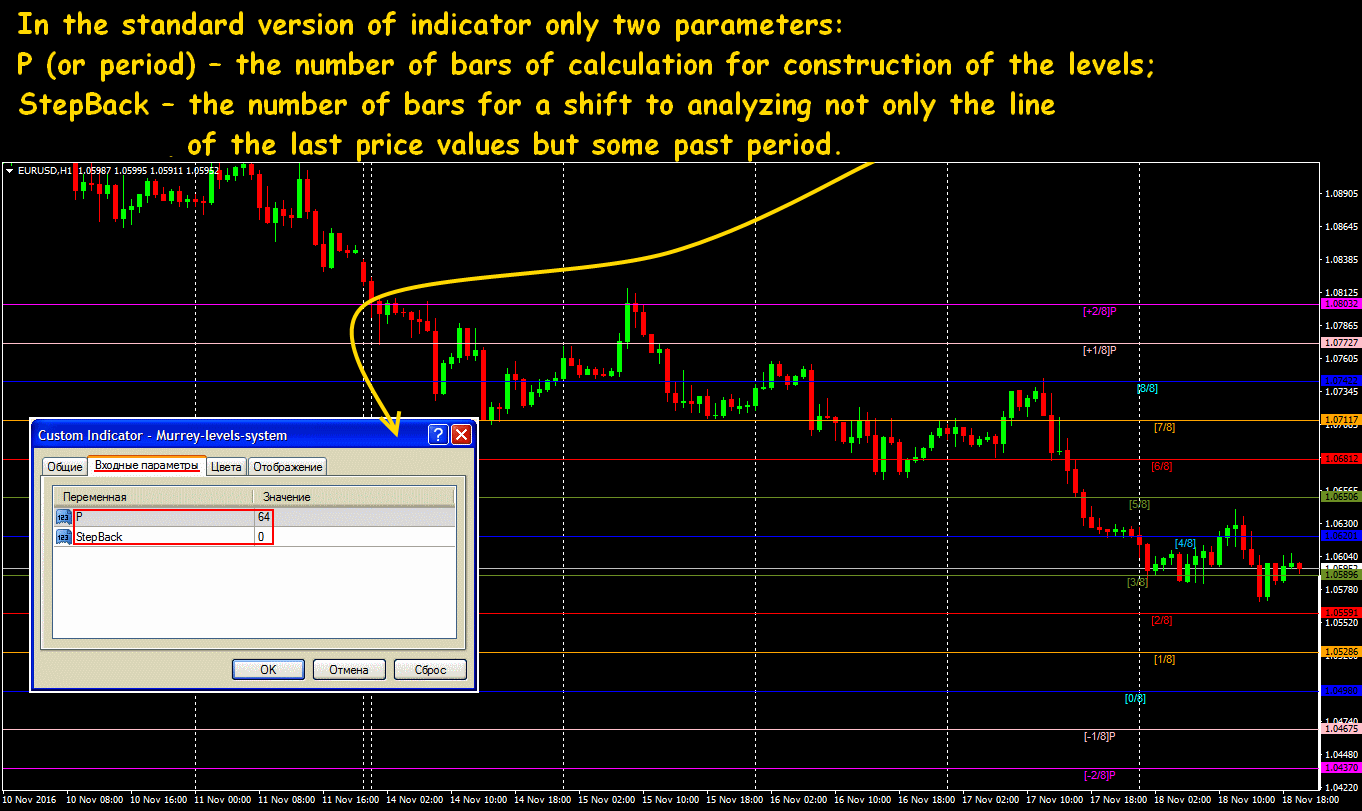
The parameter P – the time frame, which is the basis for calculation of the highest max and the lowest min for actual Octave. In particular, the width and frequency of redrawing of the levels will depend on it: too big value will «hold» the price movement between the base levels, and too small will construct thin volume and will cause the frequent redrawing. There are no decisive recommendations for the setting of the Murrey`s indicators, but there are the main options:
- To apply the values by default, suggested by Murrey (64) – the best possible for the analysis of daily charts;
- To pick up by tests comfortable value, divisible by 8 (for instance, 128, 256) to make sufficient width of range and the main levels ([0/8], [4/8], [8/8]) will be the strong lines of support/resistance.
- To select empirically the value P=200 matching by practice traders (it makes sense only from D1 above).
- To use annual value P=256 (according to Gann`s logic).

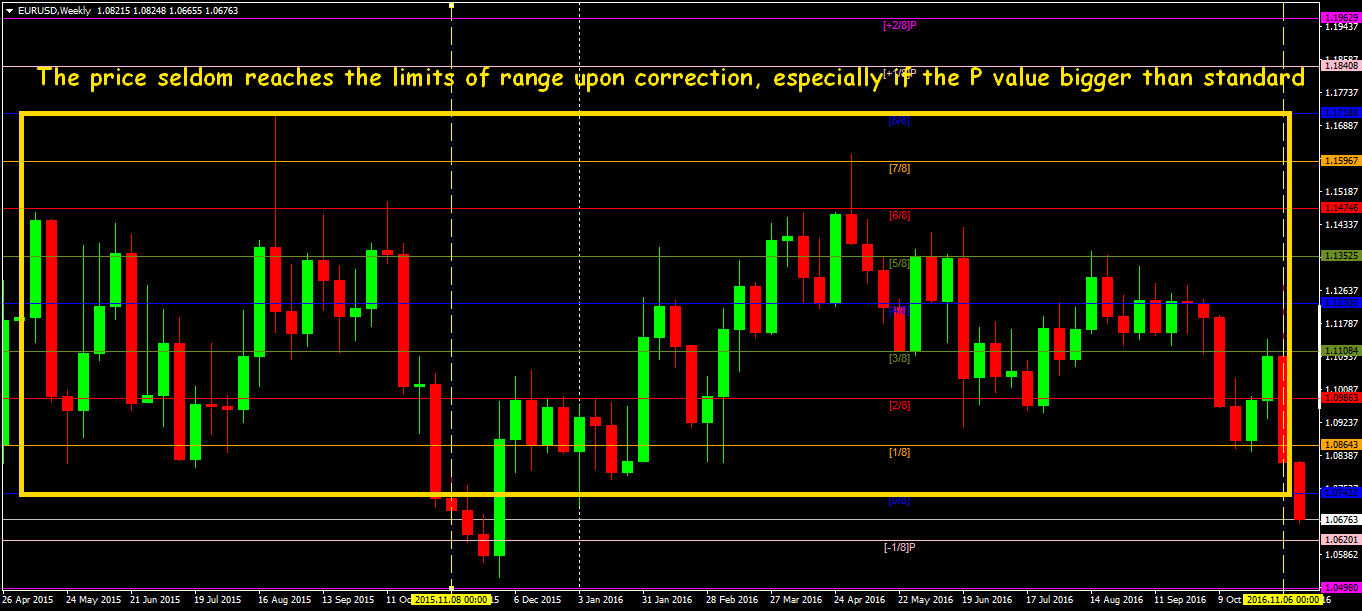
The Murrey`s levels with the P=200 parameter reacts on changes faster than with the P=256 parameter, but they are reconstructed much less often than with P=64 parameter and gives the bigger width of the range.
The most of the offered indicators practically senseless to change of a time frame. If the value of line coincides at the several periods (±5-10 points) then its trade value is increasing.
Important: in the case of speculative price movements all versions of the indicator are redrawn.
The practice shows that Murrey indicators are practically inapplicable for the short periods and for a scalping – they badly catch «short-term» cyclicality even in complex with additional tools.
Let`s stop only on some practical features and tasks of levels and will begin from the center – from the line of balance.
[4/8]
The base predicted level is considered as the most profitable for the opening of new positions. If the price is higher [4/8], then it is the strong level of support, if it is lower – level of resistance. The price fluctuates quite long time in the zone [4/8] before the breakthrough, therefore before an entrance you have to check the price have settled higher/lower than the level.
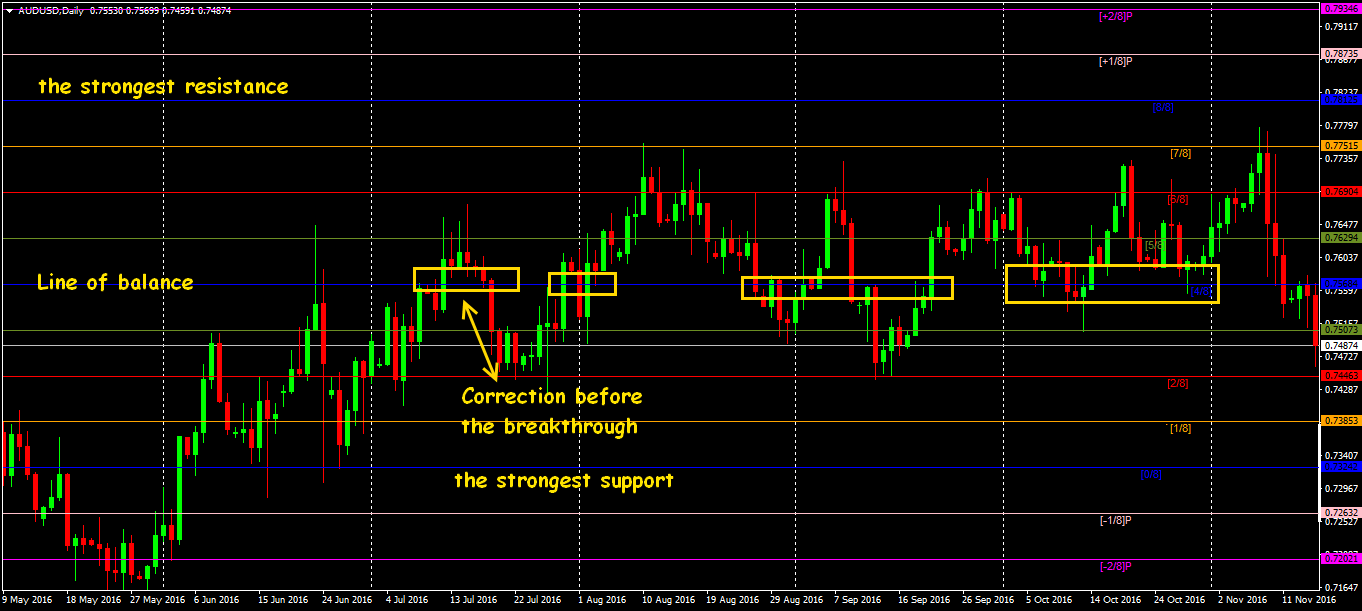 Limits of the main range – very strong obstacle for the price, the availability of strong trend is very important for its analysis. If not a turn, but at least correction begins from these zones. But if the price achieves zone [0/8] on the bull trend, then a high chance of turn and it is a good moment for entrance. Lines becomes stronger if they coincide on the varioustimeframe.
That is the trend may be changed until the levels are reached and also the price may be consolidated and «hang» on them for a long time.
[7/8] и [1/8]
If the price has gone too fast far from the balance line and has stopped in the zone of these levels – we wait for a sharp kickback to [4/8]. In the case of breakthrough – it will go to [8/8] or [0/8].
[6/8] и [2/8]
The strong levels, which are secondary only to the main [0/8], [8/8] и [4/8], works on correction from zones of overbought or oversold.
The factors strengthening levels [6/8] и [2/8]:
- Any candle isn`t closed out of level (2/8 или 6/8) on the pullback;
- At the recent past, it were the levels of support/resistance.
[5/8] и [3/8]
Any asset spends approximately 43.75% of trade time in this range and from the point of view of the trend is defined as in abeyance. According to Murrey, the market goes through hard times when the price is interim this trading range and hard to leave it. But if the limits are broken the price will hard to return back into the trading range.
If the price moves near levels [5/8] or [3/8] during 10-12 bars you should open the position in opposite direction, if it moves higher/lower than levels the tendency will remain and you should enter according to the trend. The goals are on the levels [8/8] or [0/8] depending on the direction of a breakthrough.
The Murrey`s levels are not corrected after each bar as most of the indicators, but they are redrawn anyhow on the strong turning point of the trend. Two pairs of additional levels are used to «catch» such moment.
[-1/8] и [+1/8]
«The extreme support» on the bear trend and «the extreme resistance» on the bull trend: the breakthrough of these levels means a signal of the end of current trend and creation of conditions for the opening of trading positions in opposite direction.
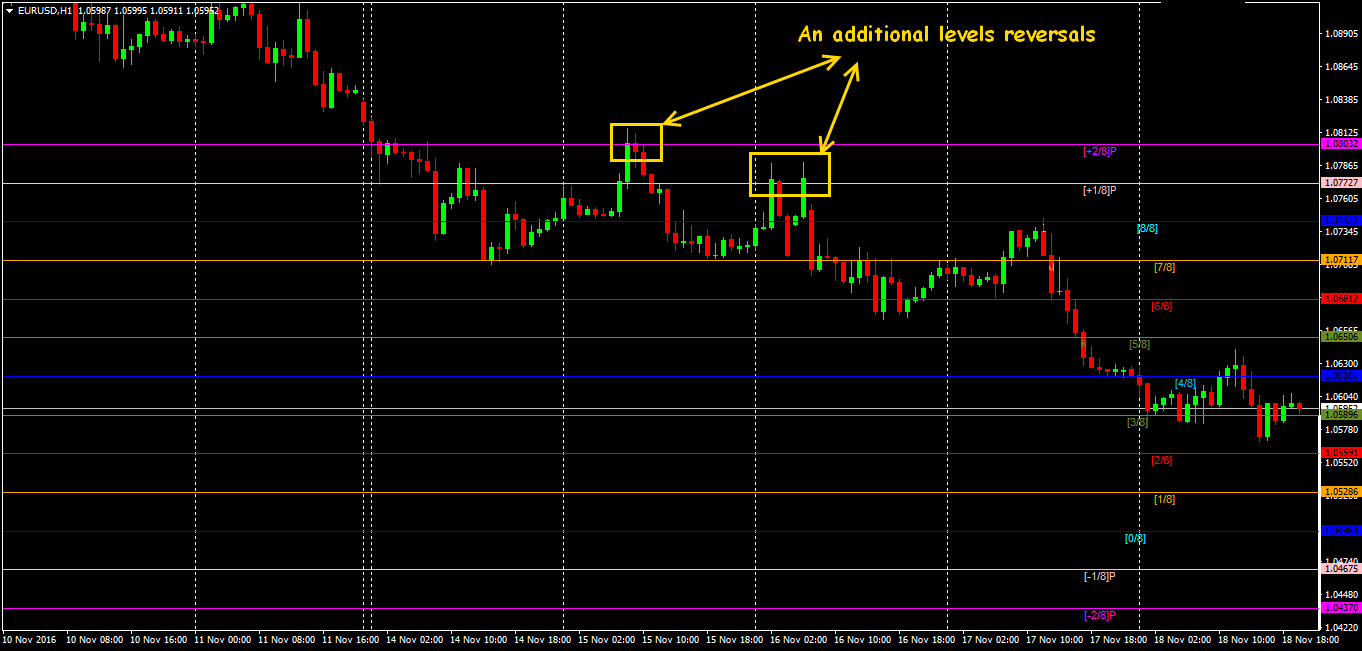
Nevertheless, levels [-1/8] and [+1/8] have quite weak statistics of real reversals: often kickback from them means only temporary correction (till the levels [0/8] and [8/8] respectively), after which it continues to move in the former direction.
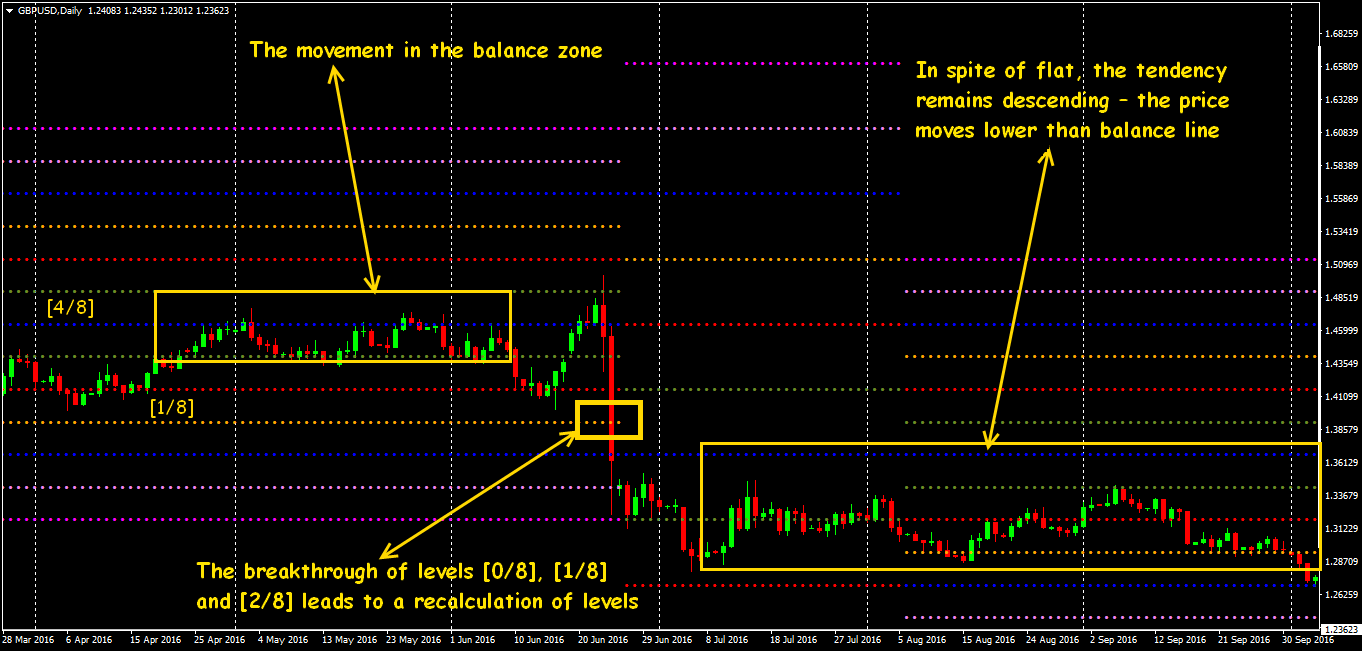
[-2/8] и [+2/8]
«The final support» and «the final resistance» in the case of breaking through these levels by the price, the market almost always remain the movement in the direction of breakthrough – it means so strong trend that current Octave is recalculated and the levels (more than likely) need to be reconstructed within the new local extrema. In the case of the work with daily charts Murrey recalculated the Octave only if 4 or more candles were closed higher/lower then [+2/8] or lower then [-2/8], but now all popular versions of indicator for MT4(5) recalculates the levels automatically regardless of number of candles within the level and in case of any P parameter.
The additional levels [-2/8], [-1/8], [+1/8] and [+2/8] are much weaker than the others, but they may become as support/resistance in the case of price exit out of limits of the main ([0/8] и [8/8]), and steady breakthrough/kickback of the price in these zones means the following profound changes in the market – the beginning of a new global tendency.
Recalculation and the new levels
The Murrey`s indicator with an accumulation of history of redrawings is required to see the complete dynamics of the previous levels. A new calculation of the levels is connected with the change of volatility and may be of several types:
- The narrowing of the range (the volatility decreases);
- The widening of the range (the volatility grows), often the reason is the breakthrough of the additional levels [+2/8] and [-2/8];
- The full reconstruction and creation of the new trading goals.
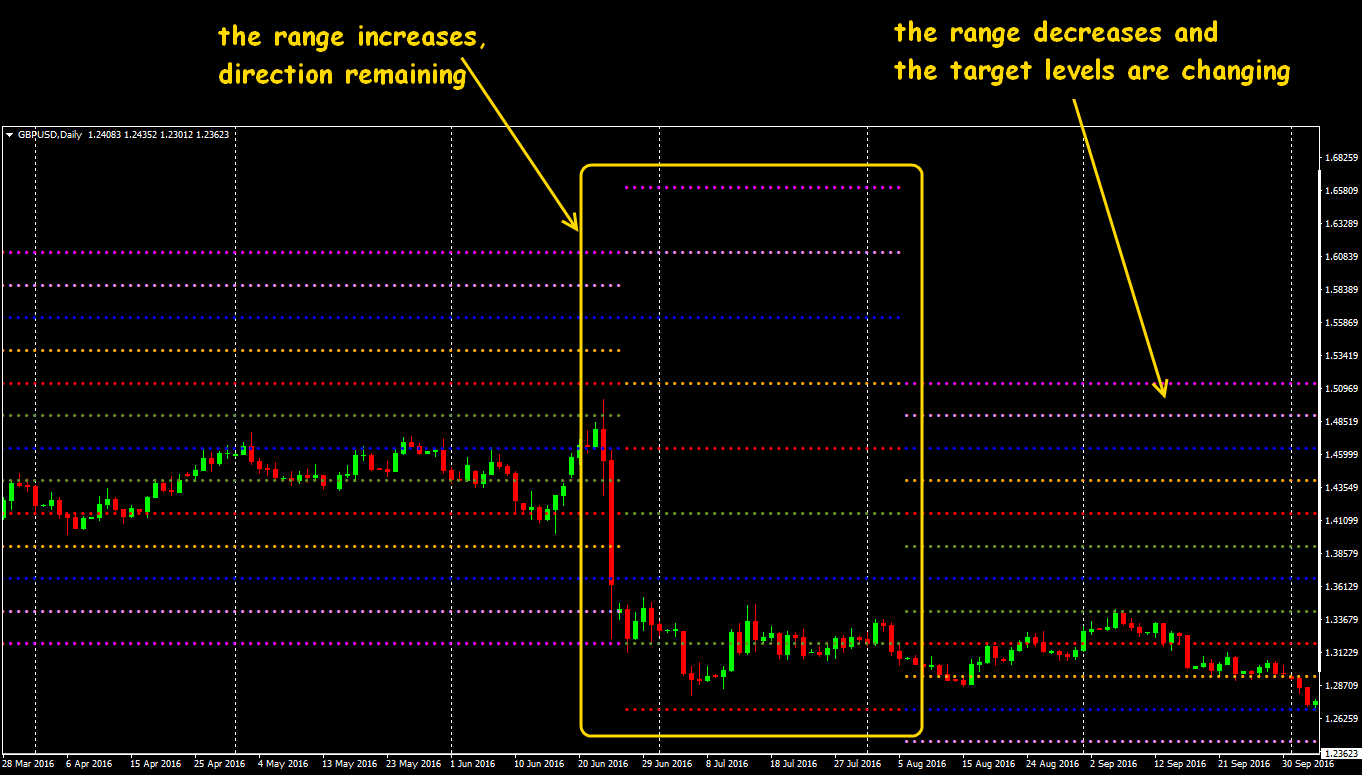
The displacement and mutual change of the basic levels ([0/8], [4/8], [8/8]) are the most often:

The patterns on the Murrey`s levels
The fans of graphical analysis rather successfully use the situations which may be quite considered as price patterns.
Scheme [0/8]–[4/8]–[1/8]–[8/8] or [8/8]–[4/8]–[7/8]–[0/8]
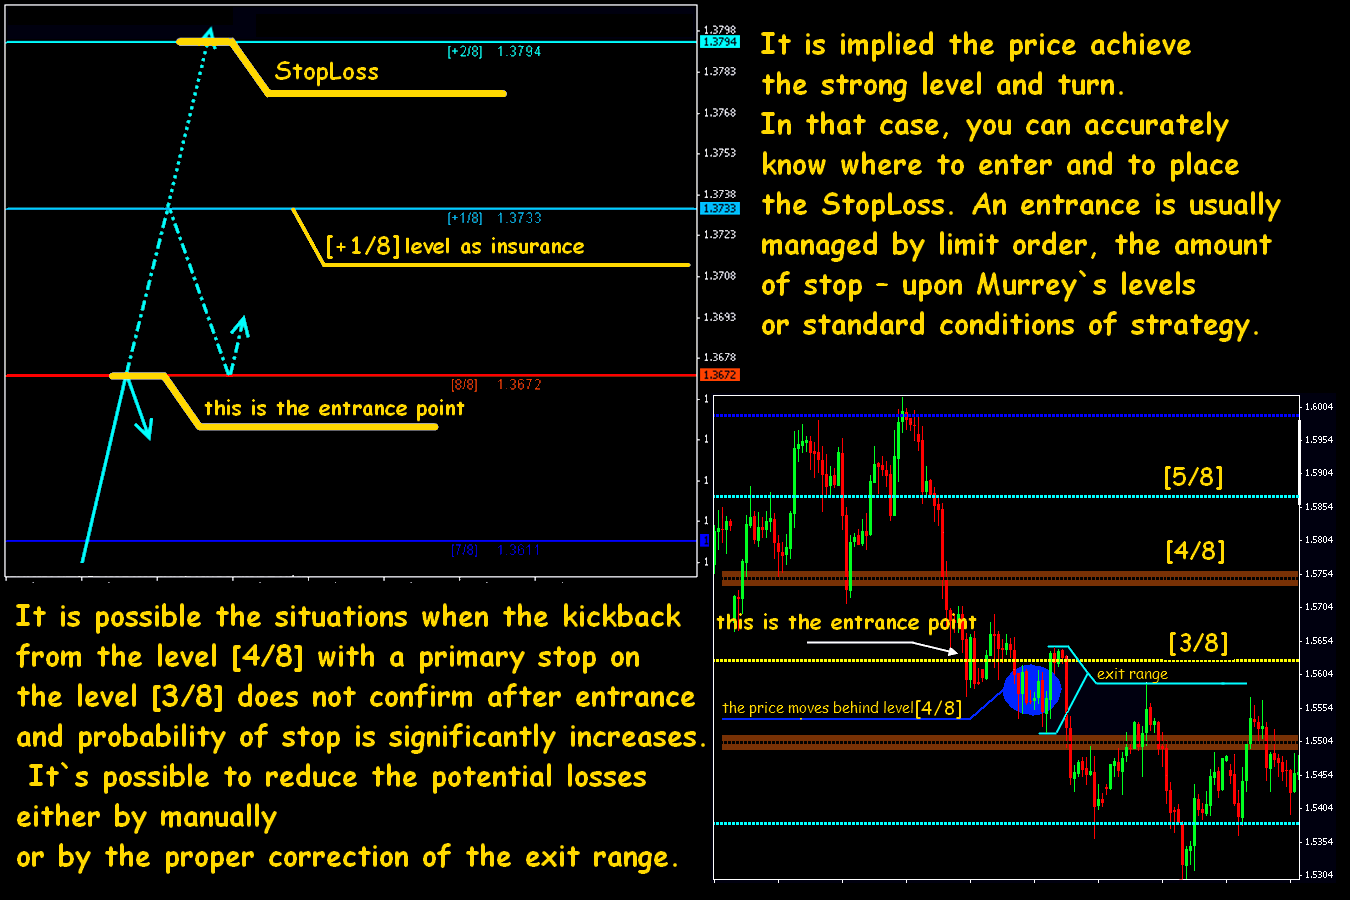
The amount of development is high in the case of good proportion of risk/profit, but within the movement on the pattern the levels [7/8] and [1/8] may be the strong hindrance.
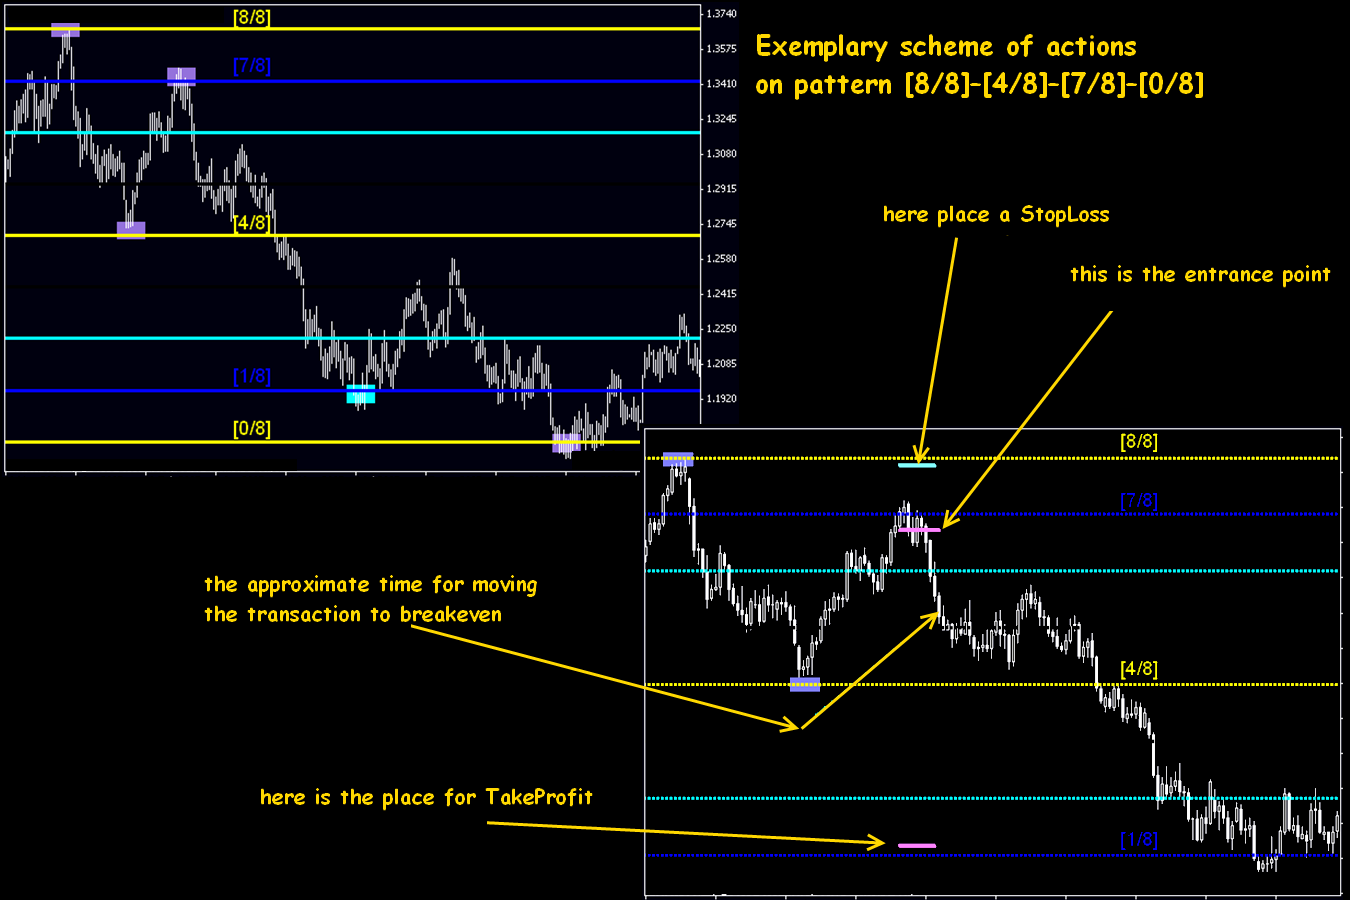
If there are several unsuccessful tests of the level on breakthrough up it`s necessary to enter the transaction only after the price stop on [7/8]. The first StopLoss – on [8/8] (if the price reaches this level then the pattern is canceled), the first part of the profit we lock on [1/8] because there are long corrections (within the current pattern) are possible. We move the Stop to a breakeven after the price fixed lower than the level [6/8].
We reason by the same way for rising trend.
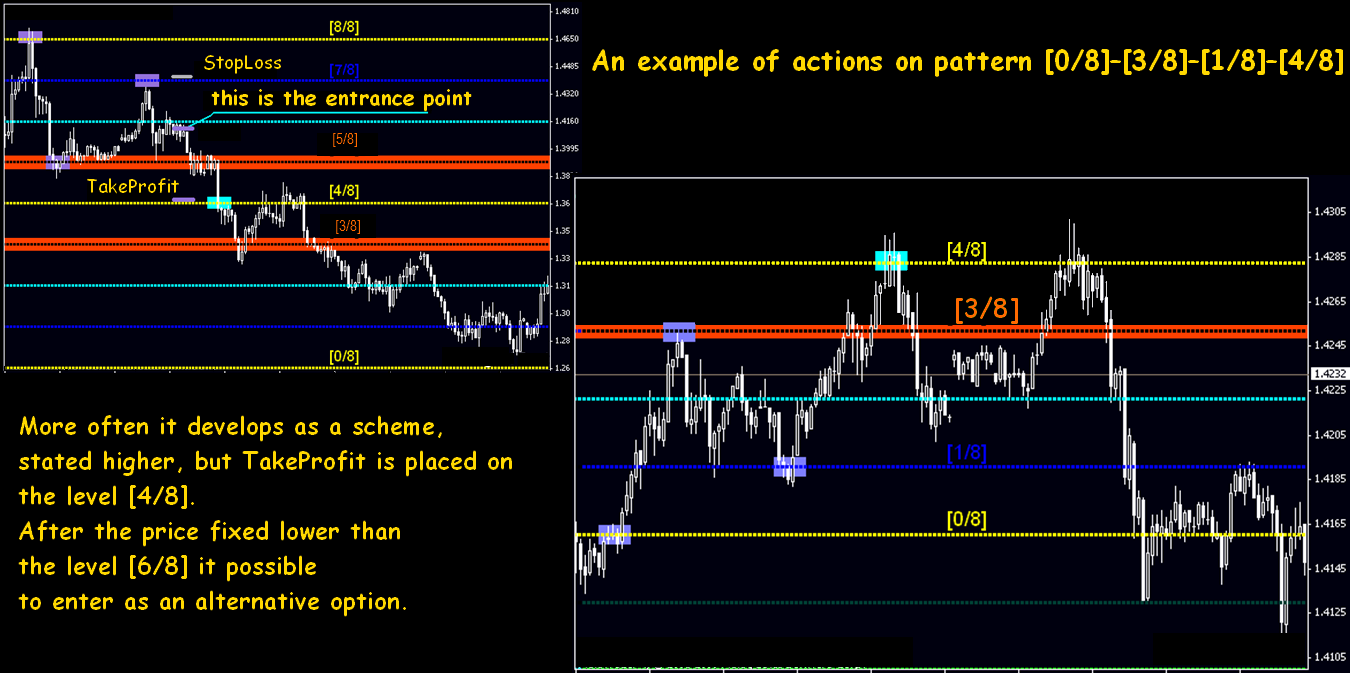
Scheme [0/8]–[3/8]–[1/8]–[4/8] or [8/8]–[5/8]–[7/8]–[4/8].
They appear quite often, especially on currency assets.
 The signals of the Murrey`s levels
It is considered that it`s possible to obtain all types of trade signals within the Murrey`s trade system. Let`s consider the standard options.
The signal for kickback from the level
In the case of use of such technique the initial stop – obligated!
The signal to turn
It appears mainly on the levels [1/8] and [7/8]. It`s not visible prior should enter from the level or not because the signal may be identified only after unsuccessful test of the level.
In the case of the entrance from the level [1/8] the opposite tactics may be applied. If the price achieves [0/8], then the reject of the turn signal on the level [1/8], and from the other side – probability to move the open position in the black. [0/8] – is very strong level, in its zone on the descending movement often there is a strong bull correction and it is possible to apply easy averaging.
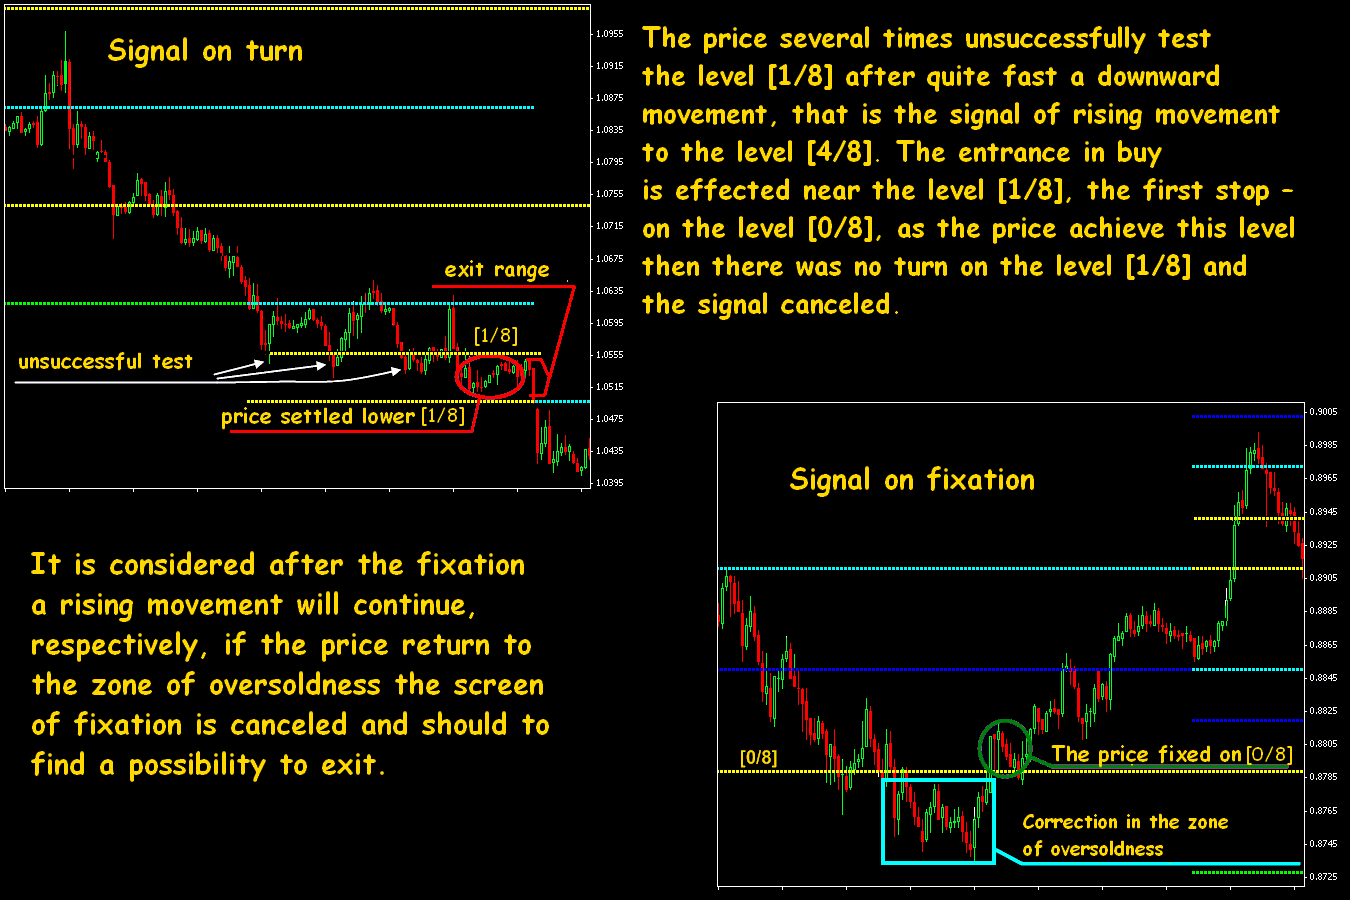
The signal on fixation
An entry after distinct fixation out of level, for instance, is higher than [0/8], at the exit from the oversold zone. The signal appears concerning continuation of rising movement, which has begun in the oversold zone.
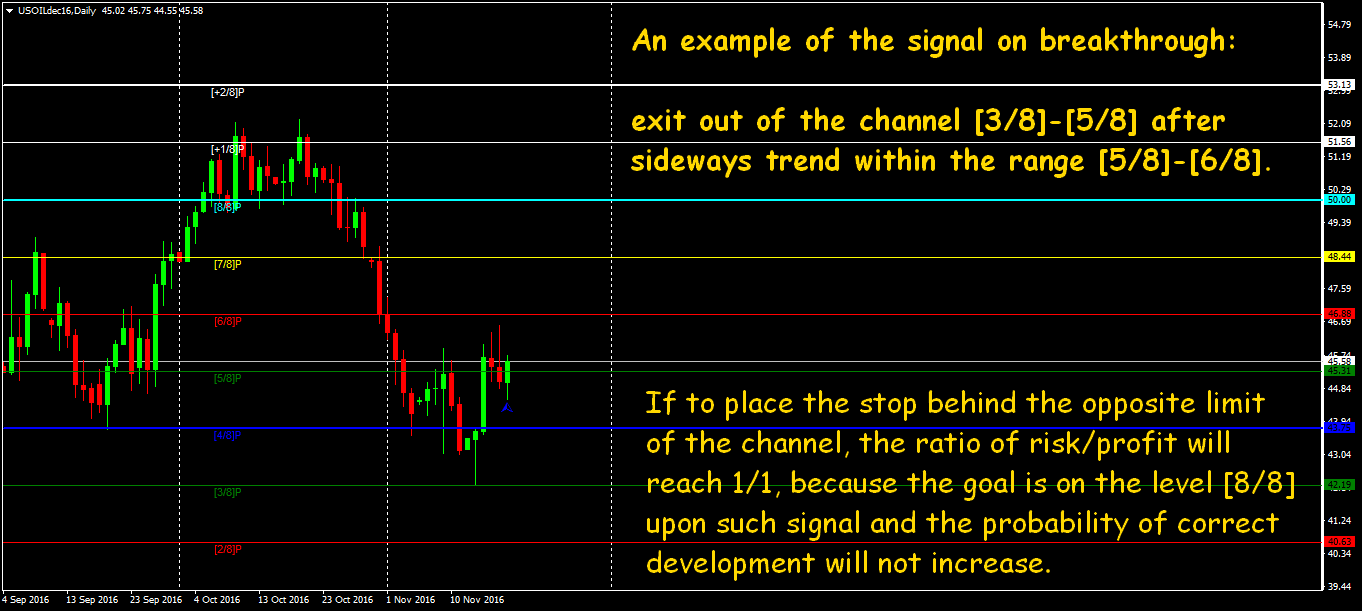
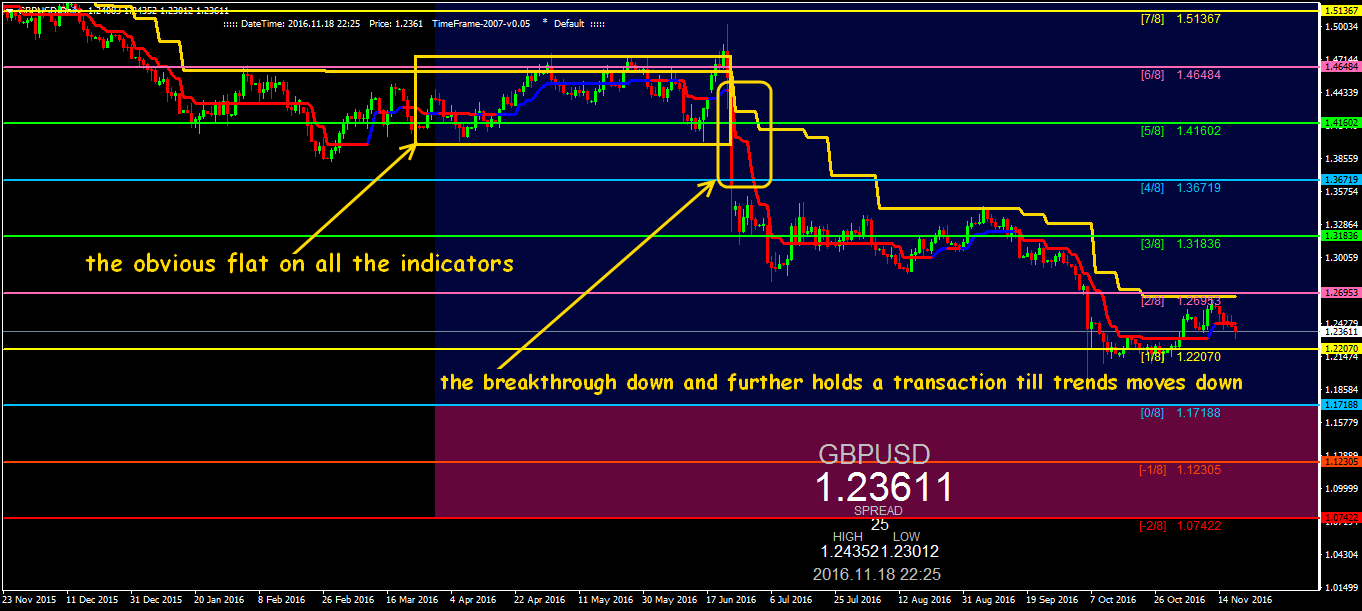
The signals on breakthrough
They are similar to the signal on fixation, and the problem with the stops are the same. The danger of such signals – «false» breakthroughs, which can be recognized only by additional indicators. Stop, respectively, should be placed either out of opposite limit of the channel, or drop an entry upon such signal at all.
Several practical tips
H1 remains the optimum period for the entry according to the Murrey`s technique, because the day news noise hinders on the shorter TF, and for the trade on longer - it can be not enough deposit in the case of a false signal. It is preferably the asset moved on H4 and D1 in the rather wide channel even if only forwarded.
In accordance with the Murrey`s system, you should trade on that asset where rather a strong trend to this or that side is forming. If there is obviously weak movement, then the breakthrough/kickback from the Murrey`s level can be only a current correction that it is impossible to consider a trade signal.
You have to analyze a big timeframe – the more confirmations in zones [0/8] or [8/8], the better. The entry against the trend on the levels [0/8] or [8/8] as riskier is available only in the cases the finalizing of the correction within the main trend on the older periods is clearly visible.The movement above [5/8] or below [3/8], with the purpose of growing to [8/8] or falling to [0/8] respectively may be considered the signals according to Murrey`s levels. The use of strong trend indicators helps to reduce sharply the number of unprofitable transactions due to trade only above/below of its lines (with due regard to behavior in the zone of levels).
The examples of use of levels along with trend indicator SuperTrend
We use two indicators of trend – the current and older period. We place the stops at some space from the line of older trend and further they may be trawled along the indicator`s line.
If we control the transaction on the time chart we place the stop on the level H4; if we trade on H4 we use a line of day CT. TakeProfit is better to place before the target level taking into account errors in the calculation of levels. 
And the conclusion …
The universality, that is effective work in any markets and at different time periods are the well-postered advantage of the Murrey`s theory. There are many trade strategies on its basis in the market, but!
As the saying is if only the trend is a friend to everyone, but the truth is much expensive. Any option of the Murrey`s tools may be only as a part of trade system, though with their help you can trade both in trend direction and against it. Anyhow the Murrey`s levels represent only certain illustrative «onlay» on the price chart and not the comprehensive indicator, and it`s irrational to define the entry points only by them, at least.
The system does not make recommendations concerning the criteria of choice of extrema, necessary for calculation. Each trader install «own» set of key points and such formatting will be always based on personal perception how should calculate the levels.
The time estimations are causes a lot of doubts in general, which nature is connected not only with mental science, but also the usual technical analysis.
- How to consider the fact that if unwind the price chart back, then there are obviously the extremes much higher and more lower, and it`s not understood why the current range should be considered as «real» for time estimation?
- Why should we hope that the market will fluctuate in constructed range in future if it was out of its limits at nearest past?
- Why should the annual range be a precedence for basic calculation? The GBP/USD pair, for instance, which renew the decadal minima on summer 2016, fully breaks all the price and time calculations.
Murrey hasn`t a reasonable answer to these questions, except certain psychological expectation the price will also be connected for some period with current range than to any earlier.
The one, the Murrey`s levels may be profitable for is a determination of strong reversal zones, especially, in the case of volatility – anyhow they look more reliable and mobile, than Fibonacci`s lines or other tools. But in the case of slightest doubt of trend continuation after kickback from the level [-6/8], [+6/8] or [-5/8], [+5/8] you should move to an analysis of smaller TF and entry to the transaction only in the case of the signal from the additional indicators. And you should always remember the Graal for financial markets is not invented yet.
Social button for Joomla