

")
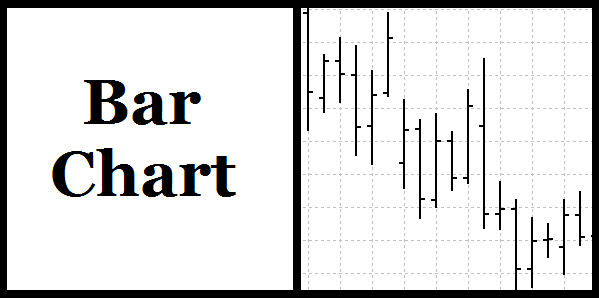
The role of any trading terminal is to provide a high degree of convenience for trading. Each trading terminal has all necessary settings and tools for complete “customization” or “adjustment”. So, there are plenty of options in any trading software to allow adjusting the visual display of the entire process of online trading. One of such points in the settings is a choice of visual display of the price chart. It is primarily a line graph in the form of a simple mathematical line, display of the prices in the form of the famous "candlesticks" and display of the chart in the form of bars. We’ll review the former type of graphical display of the prices.
Of course, the bar chart significantly differs from a line graph and a candle chart. Since the line graph has a fundamentally different nature, the only thing you can find something in common with is the candlestick chart. However, a professional needs just one glance to identify its drawbacks and advantages.
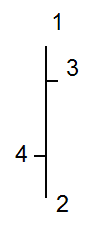
So, what can be attributed to its pros? In the first place, a bar chart has four points to analyze the price. They are the opening price (4), the closing price (3), the maximum price for a given time period (1) and, of course, the price of the minimum value. These four prices that reflect a trend or movement strength are enough for a full comprehensiveness for analysis.
Thus, these bar values carry the same information as the candlesticks values, but give more information than a line graph. Based on this conclusion, we can add that the analysis using two additional values is allowed: they are the maximum and minimum prices. The difference is that the line graph works only by the closing price, while hiding the price history of the past time interval. Thus, the bar chart has all the obvious factors that may put it in one line with candlesticks.
But when trying to find disadvantages of this chart, you should pay attention to “brighter” image of price movement. First and foremost, it is about visual perception. While the picture of candlesticks with black and white candles bodies can be considered and understood quickly, the situation is different with the bars. A glance at the bar chart creates a heavy feeling of complexity in the process of examination, which is due to a large number of vertical and horizontal stripes the bars consist of. Visual perception is further complicated by the fact that the opening and closing prices are constantly changing, which makes you spend a little more time on the visual examination of the chart.
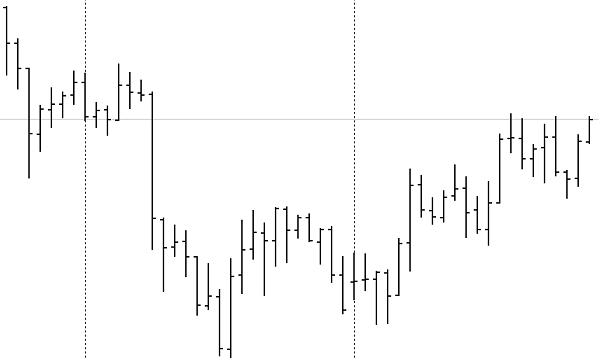
However, despite all the monotony of visual perception, the bar chart conveys all the information necessary for online trading. This means it has almost everything the candlesticks can tell. The interpretation of combinations used in the analysis of the chart is also possible. You can also determine the levels of minimum and maximum values for a certain period more accurately. The lines of support-resistance levels and divergence-convergence are also built more accurately.
In short, this type of chart has all the necessary features inherent to candlesticks and has more advantages than a line graph. Price movement bars are to date a no less important reflection of price fluctuations than other price values of the main price chart.