

")
In search of monetary Graal, traders begin to complicate an analysis technique, though all the best is invented long ago and is actively used. We will try to understand what a secret of the popularity of the MACD indicator on the basis of which more than 40 years the trade systems are created, available to understanding by beginners and preferred by professionals.
As well as the majority of technical tools, MACD (Moving Average Convergence/Divergence) was developed by Gerald Appel for the stock market where, thanks to moderate volatility of assets, shortcomings inherent in the indicator were almost imperceptible. Forex traders have willingly borrowed the convenient tool, moreover – have opened additional useful opportunities, but its application in the speculative foreign exchange market requires experience and care.
The trading method of a convergence/divergence of moving averages put in the MACD indicator is used for an assessment of force and the direction of a trend, and also for the search of turning points. There is a mechanism of an assessment of price impulses in a technique, therefore, the indicator is considered hybrid (trend + oscillator), but actually, this just improved visual representation of the interaction of exponential moving averages.
Settings and a little theory
Actually, MACD shows what is declared in the name – as moving averages are mutually located. Three MA are applied in calculations, therefore, the main characteristic of the indicator is smoothing of data, therefore, it may allocate the dominating tendency among price «noise». Chronic delay becomes a payment for it, that is almost imperceptible at trend trade and devilishly disturbs at a scalping.
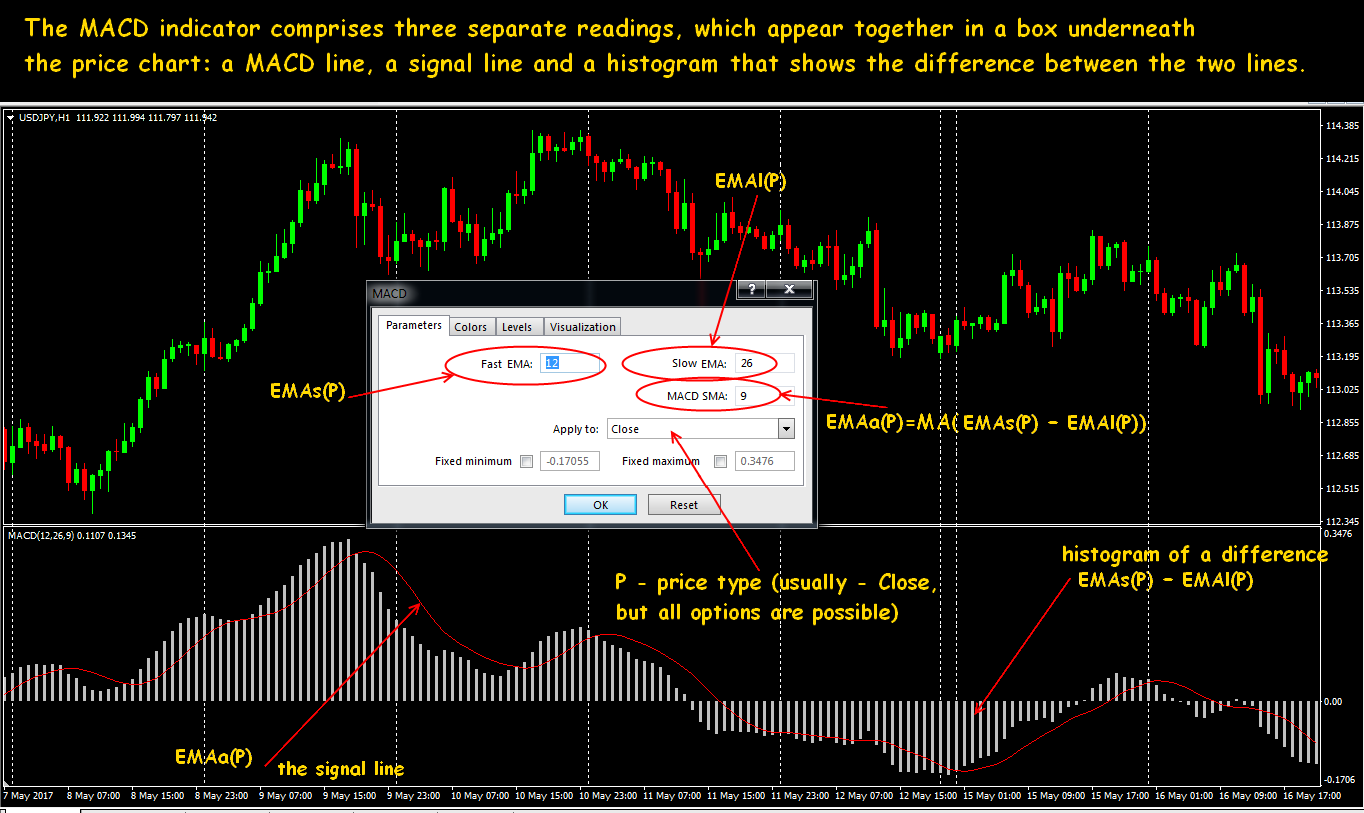
Calculation formula of MACD=EMA(PL, close) − EMA(PS, close), where EMA – exponential MA; PL, PS − the long and short periods, as a result, it gives the fast MACD line (or the histogram). The value of short average is subtracted from the value of long and once again averages as the simple MA, to remove random waves, as a result, we receive a so-called signal line: Signal=SMA (MACD,PA), where SMA – simple moving average, PA – its signal period.
Actually, the wonderful Williams Awesome Oscillator (AO) is the modified version of MACD with constant parameters of moving averages.
All popular trade programs (Metastock, Trade Station, MetaTrader, Dealing Desk) place the MACD indicator in a separate window with the mandatory zero line, but sometimes you can meet versions of the indicator directly on the price diagram. Most of stock exchange analysts still use MACD in an authoring look – two lines in an additional window which intersection is considered a trade signal.
It is interesting that habitual to all by default parameters (12,26,9) Appel recommended only for persons interested to sell, and for buyers, in his opinion, more approach (8,17,5). Persons interested can independently experiment.
The analysis of a trade situation on the MACD indicator
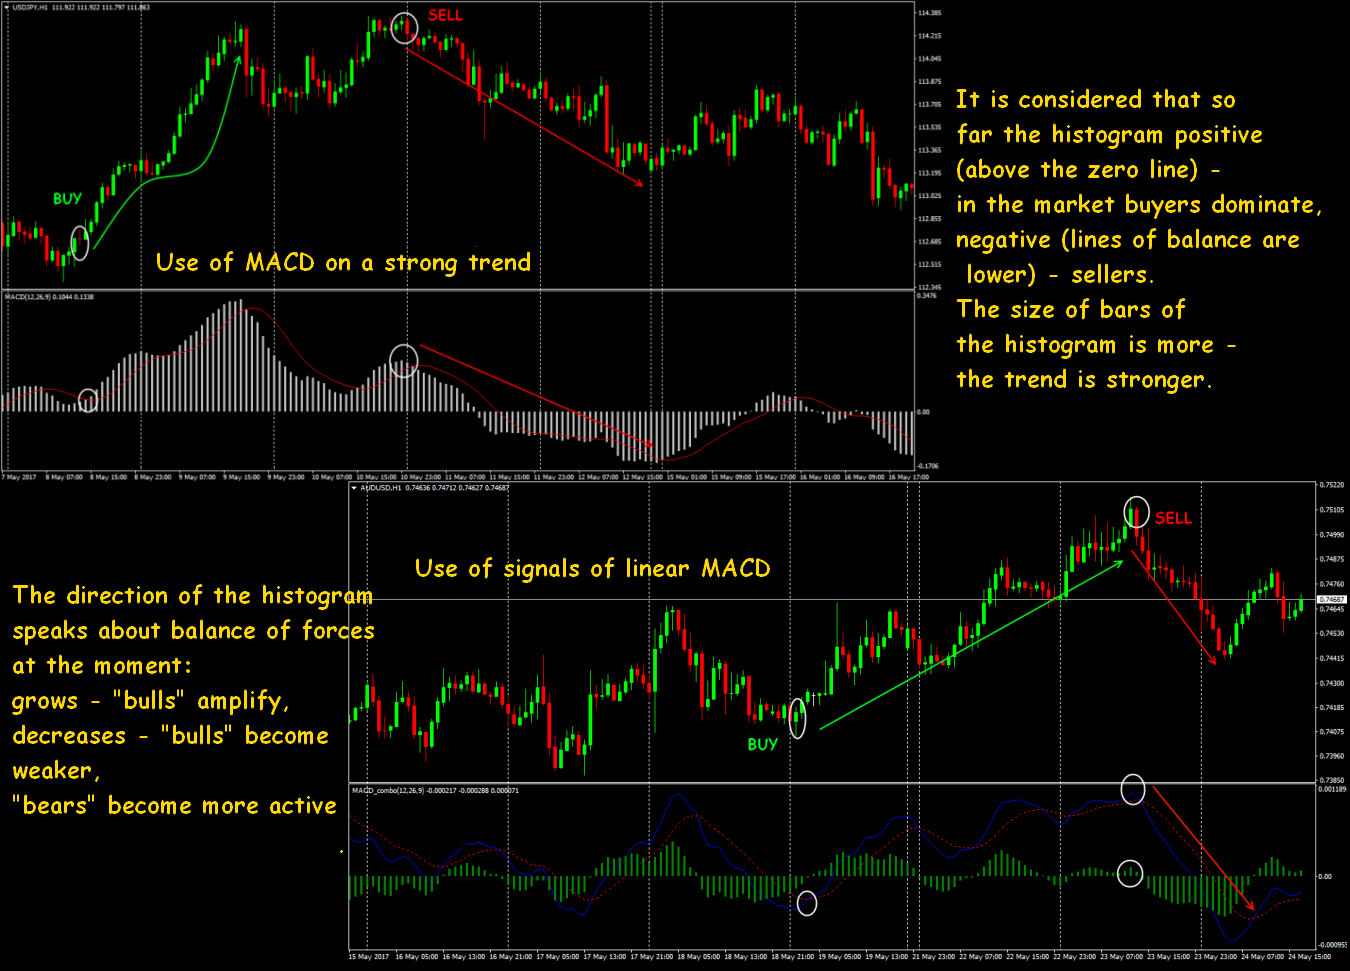
If the MACD line above zero level − fast moving average moves above slow – the bull tendency amplifies. If MACD is below zero – fast MA is located below slow – bears dominatethe market.

The intersection of a signal line by the MACD lines speaks about a change of a price momentum: from top to down – a turn on SELL; from below up – on BUY. Intersection signal line of zero level by the MACD line: from below up – a tendency on growth; from top to down – on falling.
The MACD histogram deserves special attention. In search result of a method which would advance intersections of lines of the indicator, the technical analyst Thomas Asprey in 1986 developed the MACD histogram – it is built on values of a difference between MACD and a signal line: MACDHistogram = MACD – Signal. It turns out that the histogram is not the absolute value of MACD, but an indicator value concerning its EMA(9). Most often movements on the histogram advance movements of the MACD indicator.
The relative positioning of the histogram and the zero line is the trade signal:
- the histogram is lower than the zero line (negative, the MACD line is below signal) – the descending trend in a priority;
- the histogram crosses the zero line (the MACD line crosses signal) – a signal to a turn;
- the histogram is higher than the zero line (positive, the MACD line is higher than signal) – the ascending trend.
- The signal will be more reliable when in case of the intersection of lines there is the histogram peak (on sale), and on purchase – a minimum.
In this case, it is favorable to use indicators with the color histogram − the moment of change of the direction is visible on it, and though it doesn't mean final shift of forces, such fact shall draw attention. Steady growth – purchase, stable falling – time to sell.

The point of intersection of the central line by the histogram is similar to crossing sliding for MACD.
New max on the MACD histogram warns that on the current ascending trend it is also worth waiting for new levels above current; in case of the new min on the histogram – for the descending trend we argue similarly.
In case of an obvious flat, the emergence of max on MACD can be considered a weak signal for sale, that is chances of falling of the price will be more at the time of breakthrough of a flat. At the emergence of min – the weak signal on purchase says that after breakthrough buyers will be stronger.
The behavior of histogram allows not just to estimate who stronger in the game «bulls» - «bears», but also the speed of development of a tendency. A histogram inclination up – buyers act more actively (that on Forex is perceived as is «stronger»), an inclination down – sellers. Change of the direction of an inclination is a trade signal of the MACD histogram: from below up − on purchase; from top to down − for sale.
If the price grows visually, and the histogram is turning down, it means that growth rate decreases and it is possible to curtail purchases gradually and to begin a search of entry points in sales. The growth of the histogram on the descending trend suggests, at least, to improve stops in sales and to prepare for a turn up.
Divergence on MACD as a trade signal
The main principle of accumulation/distribution of money in a trade asset is the cornerstone of exchange divergence, and if it is possible to see it in time, then it considerably increases chances of trade in the direction of «big money». Here you may read in in more detail about all types of divergence: due to properties of the oscillator, all of them are shown without fail, even the smallest, on the MACD histogram. The movement in the direction of a point of intersection of moving averages which corresponds to zero bar on the histogram is called a convergence. The situation at which the direction of moving averages disperses from the direction of the histogram is called divergence.

For adoption of the trade solution, the divergencies on MACD are usually divided into two groups: max/min divergence and divergence of an inclination. At least, 2-3 extrema in one direction are necessary for the max/min divergence. Such constructions can cover the periods from weeks to months and it is necessary to analyze them, at least, on day schedules. Inclination divergence − rather continuous one-way movement, it is formed, as a rule, for a shorter period. Small failures on this way, of course, are allowed either.
It is necessary to show extra care with small divergence, especially in small time frames: their signals are considered weak and most often – false. The trust is caused only by situations on the periods not below H1.
Divergencies allow to seize the moment of the beginning of a new trend, and the more the period on which the turn situation is visible, the signal is more reliable. There are whole trade systems constructed on long-term divergencies.
MACD indicator as oscillator
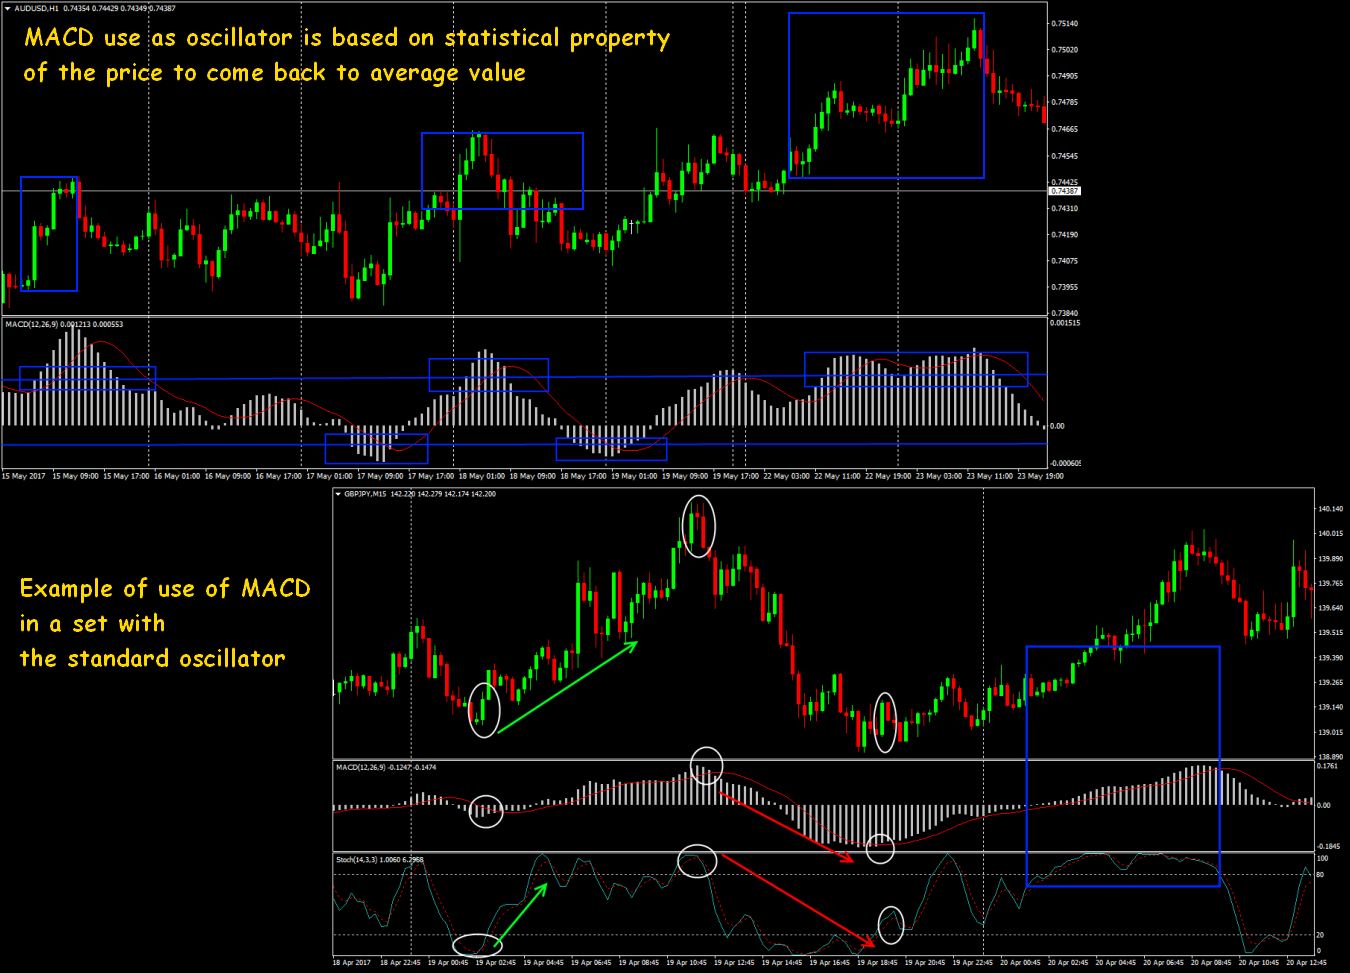
Slightly corrected price fluctuations are presented in MACD calculation by the fast MA, and fluctuation of average value by slow MA, that is fast average always lasts to slow, and the difference of these moving averages tends to zero.
There are no accurate overbought/oversold levels on the MACD indicator, the analysis of price range should be carried out «approximately». The levels 0.008-0.009 have well proved on graphics of the histogram, points of the breakthrough of such level can be considered the beginning of a correction, and this signal turns out even more reliable, than at traditional oscillators.
The delay of slow oscillators can be used on a sure trend – after the breakthrough of overbought/oversold level, the entire period of a trend the line of the oscillator will long «dangle» behind this level. But it is possible to enter purchase by the postponed orders expecting a breakthrough by the MACD indicator of some intermediate level, and to quit – in case of the simple intersection of the indicator with a signal line. It turns out that by means of levels on MACD it is possible to filter insignificant surges of the price and to catch only the strong movements. It is possible to find versions of the indicators having joint settings in popular oscillators – their signals are shown in one window:

Bunches of MACD+Stochastic is considered as rather effective. Classical oscillators well work at the unstable market and at the turn moments, but they shouldn't be trusted on a strong trend. MACD signals appear less often, but they are more reliable and will be the quite good filter for a set of stochastic signals.
It is favorable to carry out the analysis on various time frames, for example, the week histogram of MACD as the stochastic signals filter on D1, that is to use purchase signals, only when the histogram of MACD on W1 raises.
Signals of figures of the technical analysis − by means of MACD
One more example of the fact that the MACD indicator works as the price filter with almost 90% accuracy, but benefits of such technical approach are visible only at the long-term trade. In the attentive analysis, it is possible to notice standard graphic patterns on the histogram, which are rather steadily fulfilled. The separate class of the trading strategy which aren't especially advertized by brokers and traders because of the profitability works at this idea. The author of one of such techniques working at H4 time frames, famous Philipp Nell, had no unprofitable month for several years.
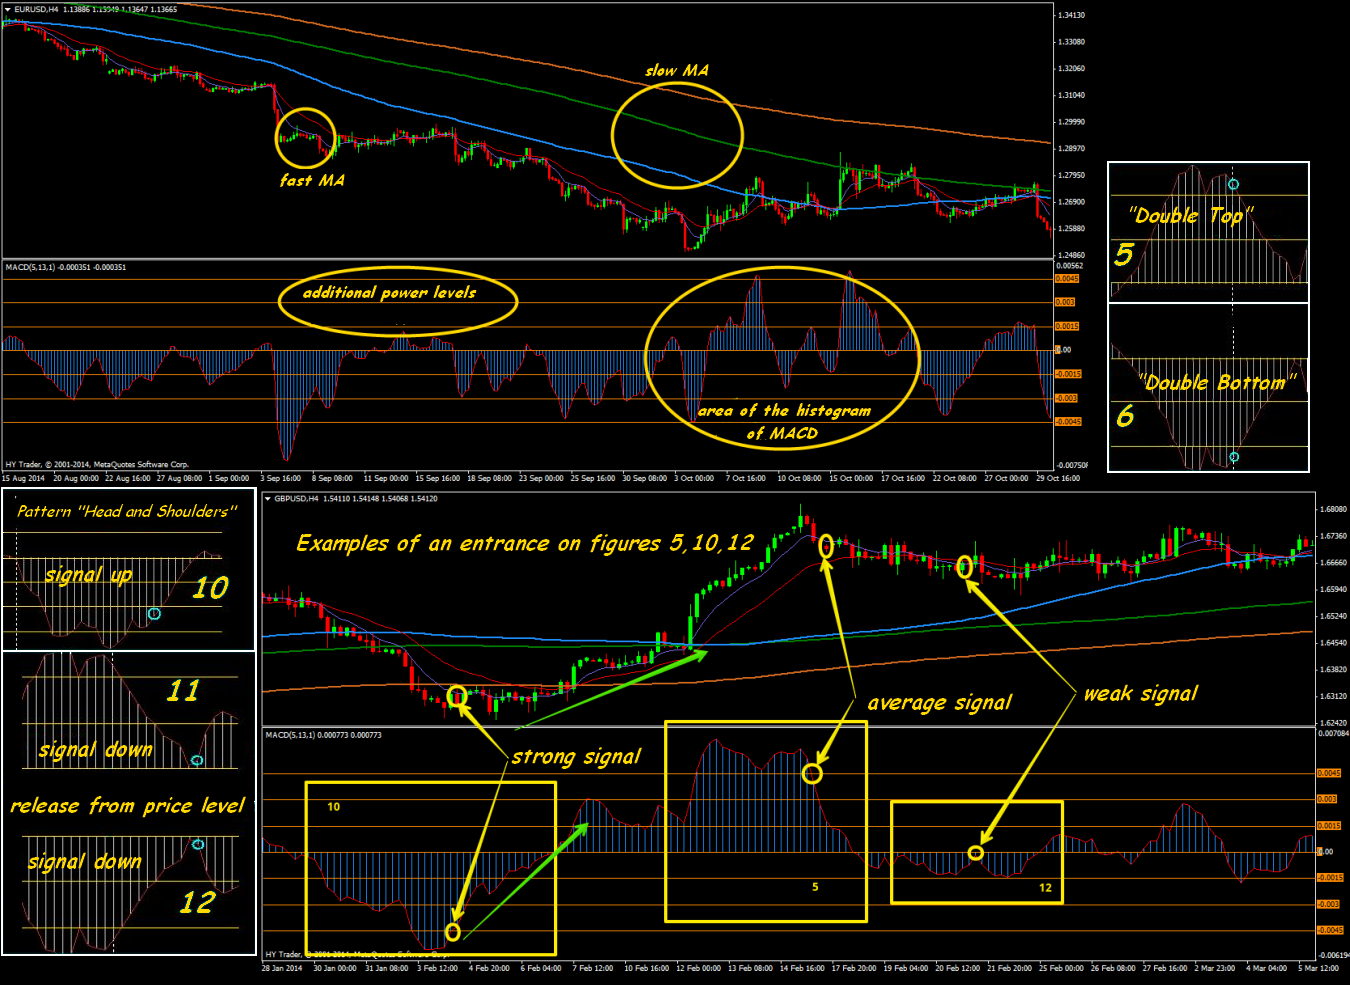
Search and analysis of these standard graphic figures is made on the MACD histogram complete with EMA and SMA with the periods from 365 to 8, and reliability of a signal is checked by symmetric power lines in an indicator window. Classical «Head Shoulders» «Double Tops / Bottom» and even «Round figures» are perfectly visible on the histogram. In these cases, usually, MACD advances events and at confirmation of a signal by moving averages, it is possible to manage to place the postponed order and to enter at the very beginning of a trend.
Trade scheme MACD+ line of a trend + support/resistance levels
The majority of trade situations with the use of MACD are intended for the indicator has to give a signal for the opening of the transaction. But the trader has to understand that the price always moves from level to level, and indicators only help to see a breakthrough or a kickback from them. MACD has to only help to identify false breakthrough and not to miss the moment of a successful entrance.
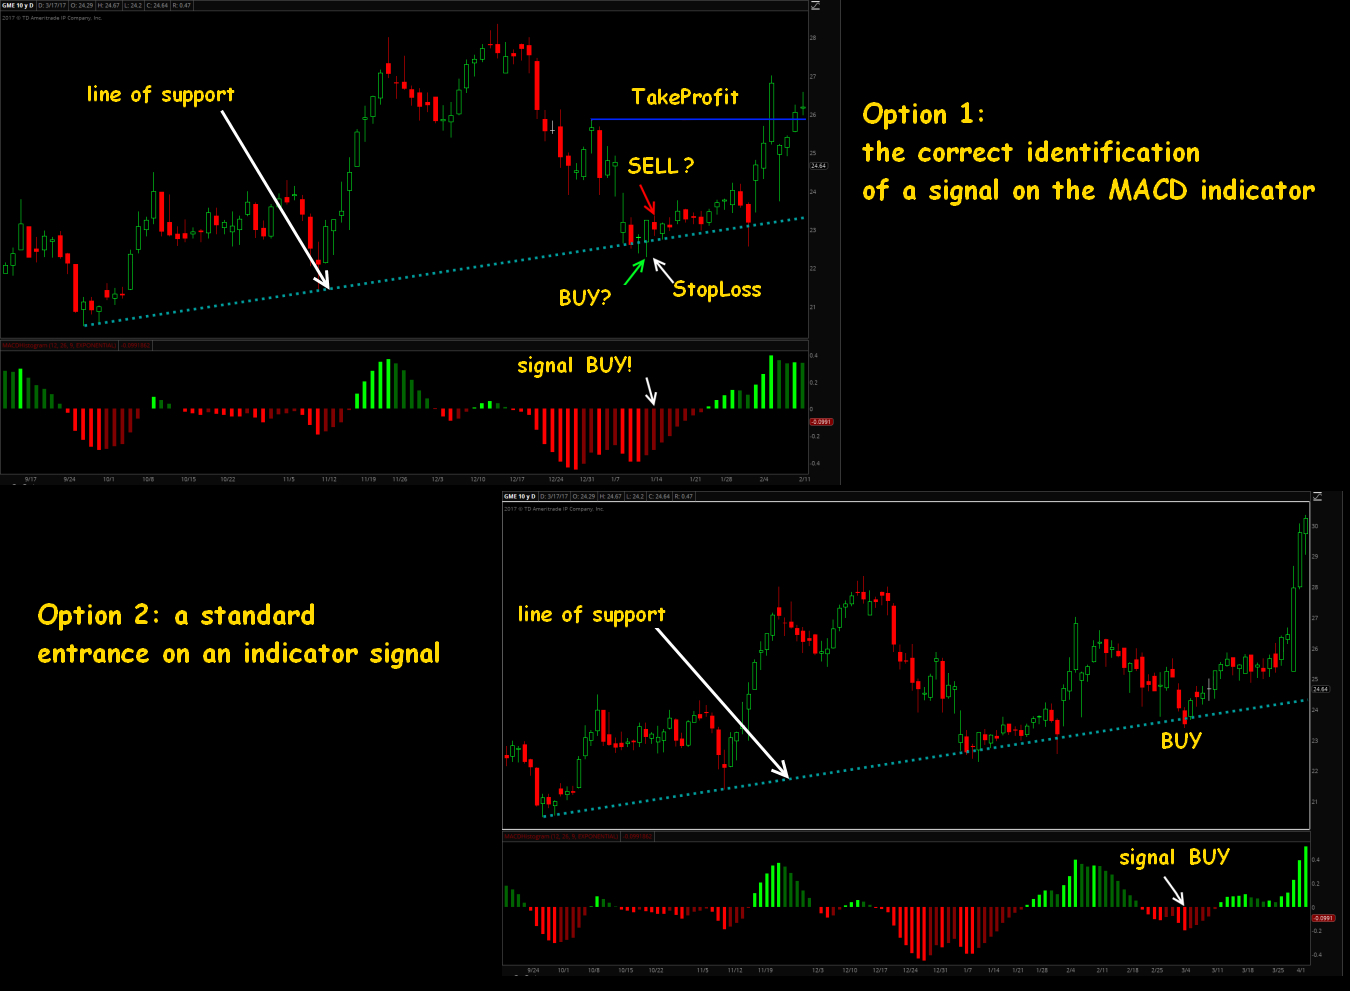
On an example: the support line is tested several times on the price schedule (shadows of candles), and on the MACD histogram a series of red bars speaks about the long period of sales and accumulation of interest on purchase including two dark bars in a row (the potential moment for opening of a long position).
The histogram has shown a number of the raising minimum during the next test. The entrance to the market needs to be made on the closing of the candle equalling to the second dark red bar, we put StopLoss under min of the previous candle, we will determine TakeProfit by the closest level of resistance.
Example on the same asset – the MACD histogram accurately indicates false breakthrough and insures the trader against the unsuccessful transaction. The same level of support is tested once again, and externally – it is absolutely correct: the red candle is closed below the line. But the indicator draws other picture: the histogram moves below the zero line a long time, and the subsequent minima (behind the index) gradually raise.
MACD as indicator of Elliott waves
One more useful property of the popular tool. We will remind that famous Bill Williams in the «Trade chaos» analyzed price waves on signals of the MACD indicator (5,34,5) in the term of the cycle in whole in 140 candles. It was not until later thathandymen have written special indicators for the search of wave patterns. Standard MACD identifies the sites which aren't affected by wave model and attempts estimating of the price movement. It is possible to use Awesome Oscillator, but this indicator doesn't allow fine tuning. However, it works better at the stock market, and the forecast turns out very inexact on Forex assets.

Using standard MACD (or AO – at choice) due to the fractality of the market, it is possible to construct a marking on various periods and to trace the transaction within wave structure of higher or lowest order. Today any of indicators can't precisely predict what period the structure is formed, but the marking on AO allows to identify the type of the current wave at least in time.

We will give examples of creation strategy stable enough on the basis of MACD below.
Example of use of the modified MACD
Rather stable system on one indicator for a medium-term scalping.
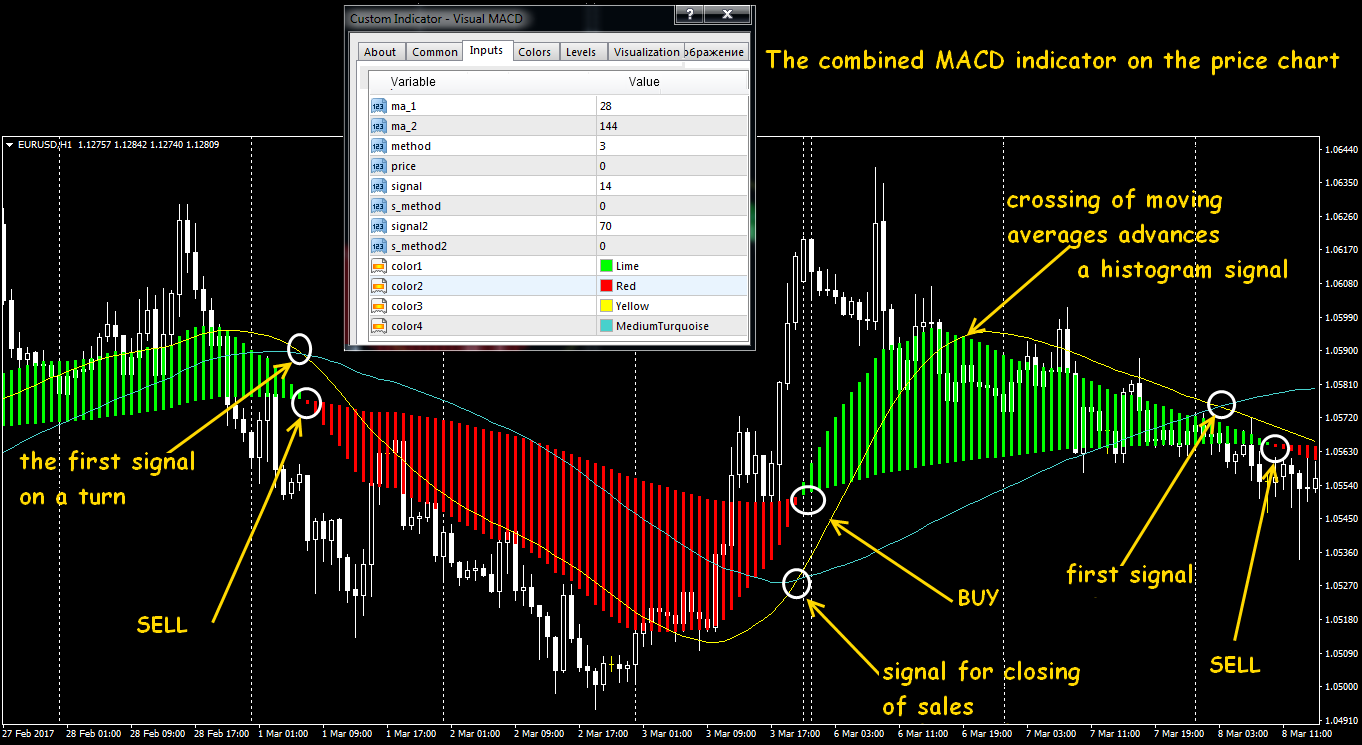
Signal: crosspoint of averages and subsequent change of color of the histogram (as confirmation). For example, while the histogram descending and red — we hold a sale. Divergence situations are well visible (additional on an entrance/exit). The dynamic basic line of the histogram plays a role of moving average line of the main trend. TakeProfit – according to money management, StopLoss − on the upper signal line.
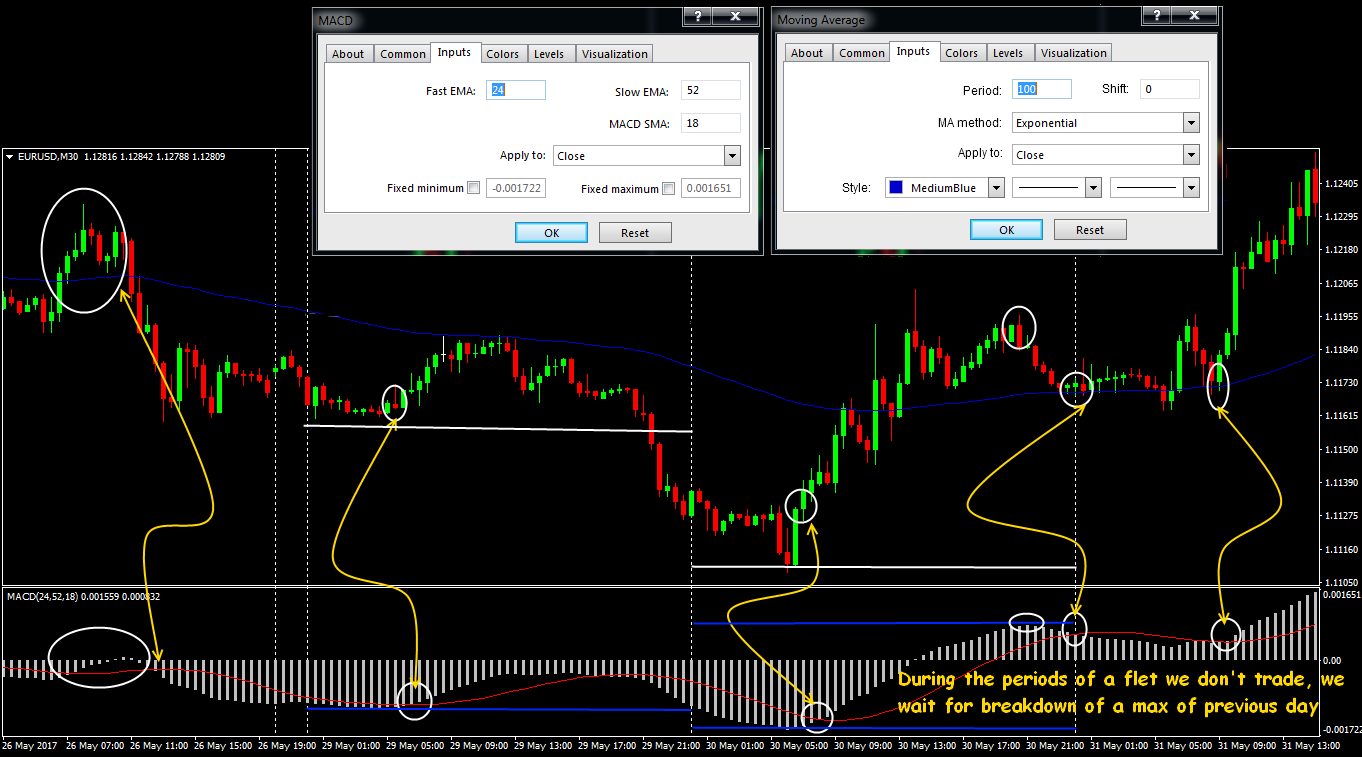
The MACD trend strategy with slow MA
Attempt to compensate delay by the long exponential average. We trade only within a day, basic currency pairs, the period of the analysis and assistance – M30. Rather slow MACD(24,52,18) and EMA (100) is necessary. We trade strictly on a trend: the price is higher than EMA – the trend ascending, if below – descending. We argue on the standard circuit further, MACD signals – basic. It is possible to close in case of dangerous behavior of the price in a moving average zone.
MAX MACD minute strategy
Though this system is actively advertized as suitable for beginners, we will remind once again: it isn't recommended scalping on MACD signals categorically.
Trade assets: currency pairs in the stable market, except for cross-pairs. Of course, it is possible to try to trade on M1, but results will be much stabler on M5-M15. The system includes two MA (to trace though some trend!) – their crossing is considered primary trade signal, if it is confirmed by the modified MACD, then it is possible to open in the direction of crossing.
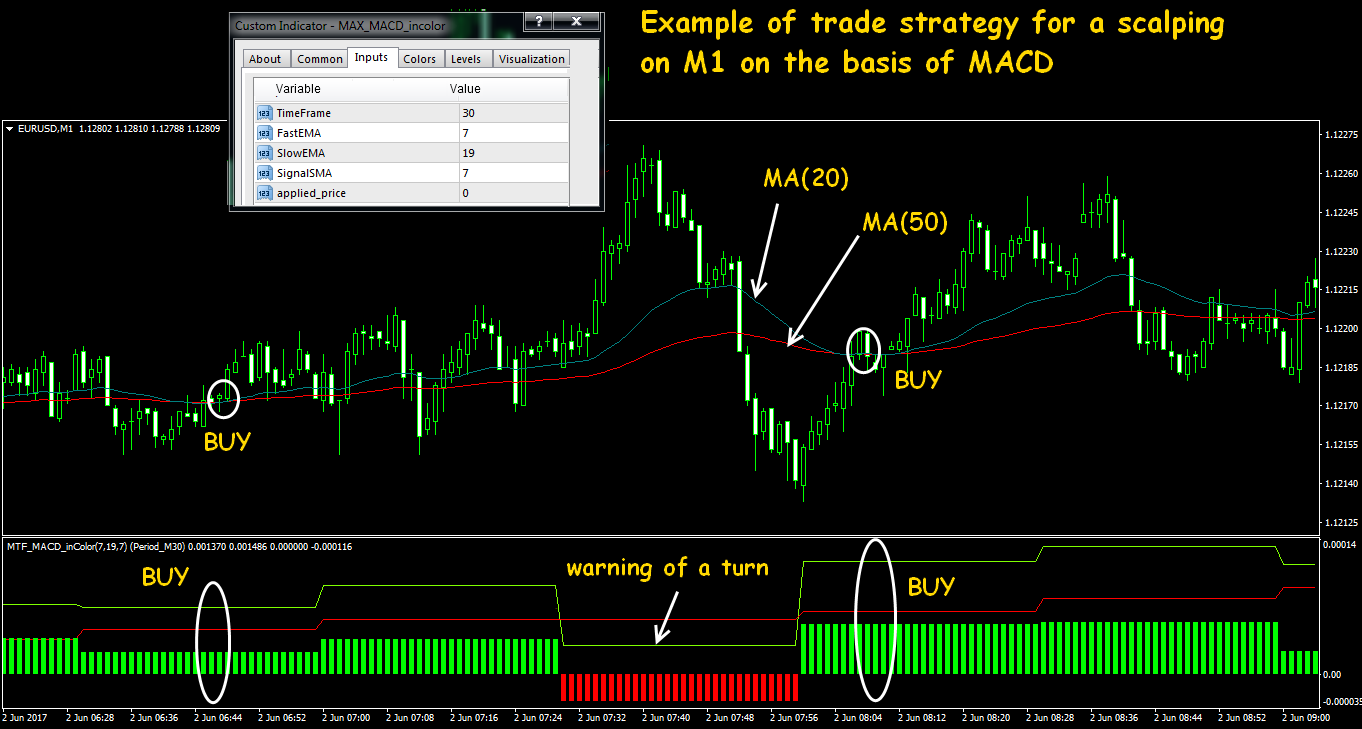
MA(20) shall cross MA(50) from below up for the transaction on the purchase, and the MACD indicator shall be a green color, it is desirable, with the maximum amplitude. The money management in case of such strategy is very rigid.
MACD+Parabolic trend strategy
It is favorable that in this system both indicators aren't redrawn. The analysis is recommended to be carried out on the period of at least M30, to accompany with transactions – on H1 above; logic – standard for these indicators. Parabolic is the basic generator of trade signals, and if after the appearance of a gap on the line during three candles there is no confirmation from MACD, then the signal needs to be ignored.
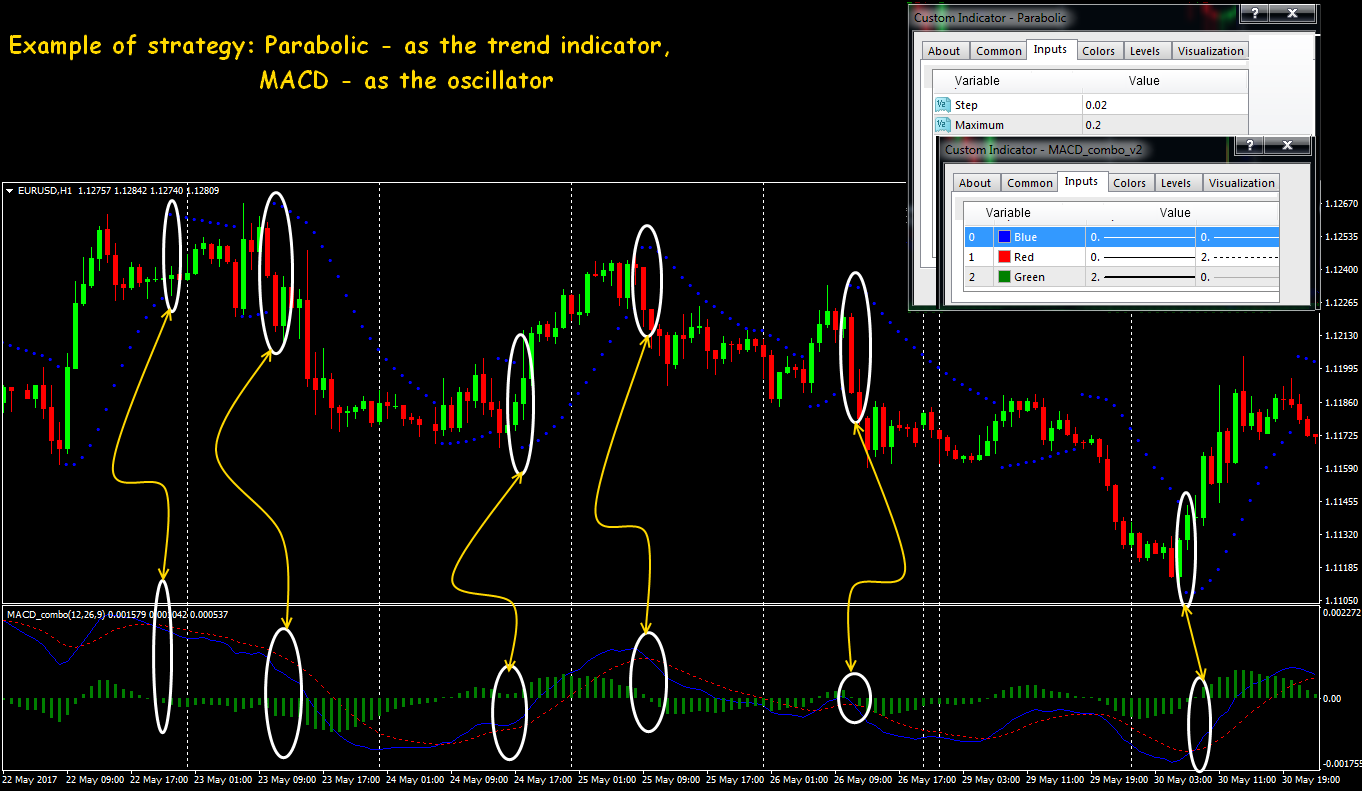
In general, the flat periods is the problem for the system, it is better to spend them out of the market. The strong transaction on an entrance to more or less stable trend quite compensates idle time.
Example of strategy on two MACD
The chronic delay is effectively compensated by use of indicators with various parameters. The offered scheme has been fulfilled on basic currencies, generally on Asian assets (JPY, AUD, NZD).
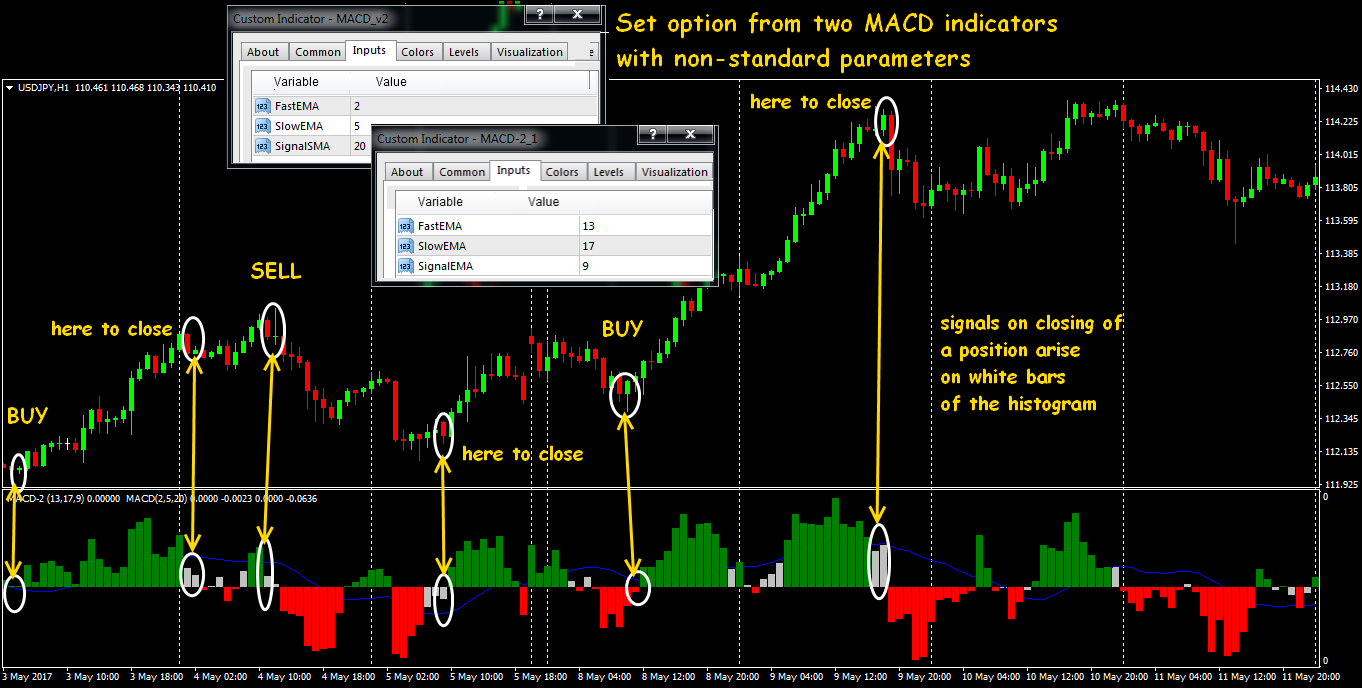
The period of the analysis and maintenance – not below H1. It turns out that faster MACD filters longer, and the histogram looks a little fragmentary, but it just reflects volatility in the smaller period. It allows estimating correctly behavior of the indicator before trade signals which are determined by the usual principle.
Set with the volatility indicator
The option allowing to catch the turning moment in a market decrease of the activity, besides, well filters the flat periods. There is no negative side effect on trade assets, but the unstable periods of the market (news, the beginning of the week, opening/closing of sessions, force majeurs) give false signals.
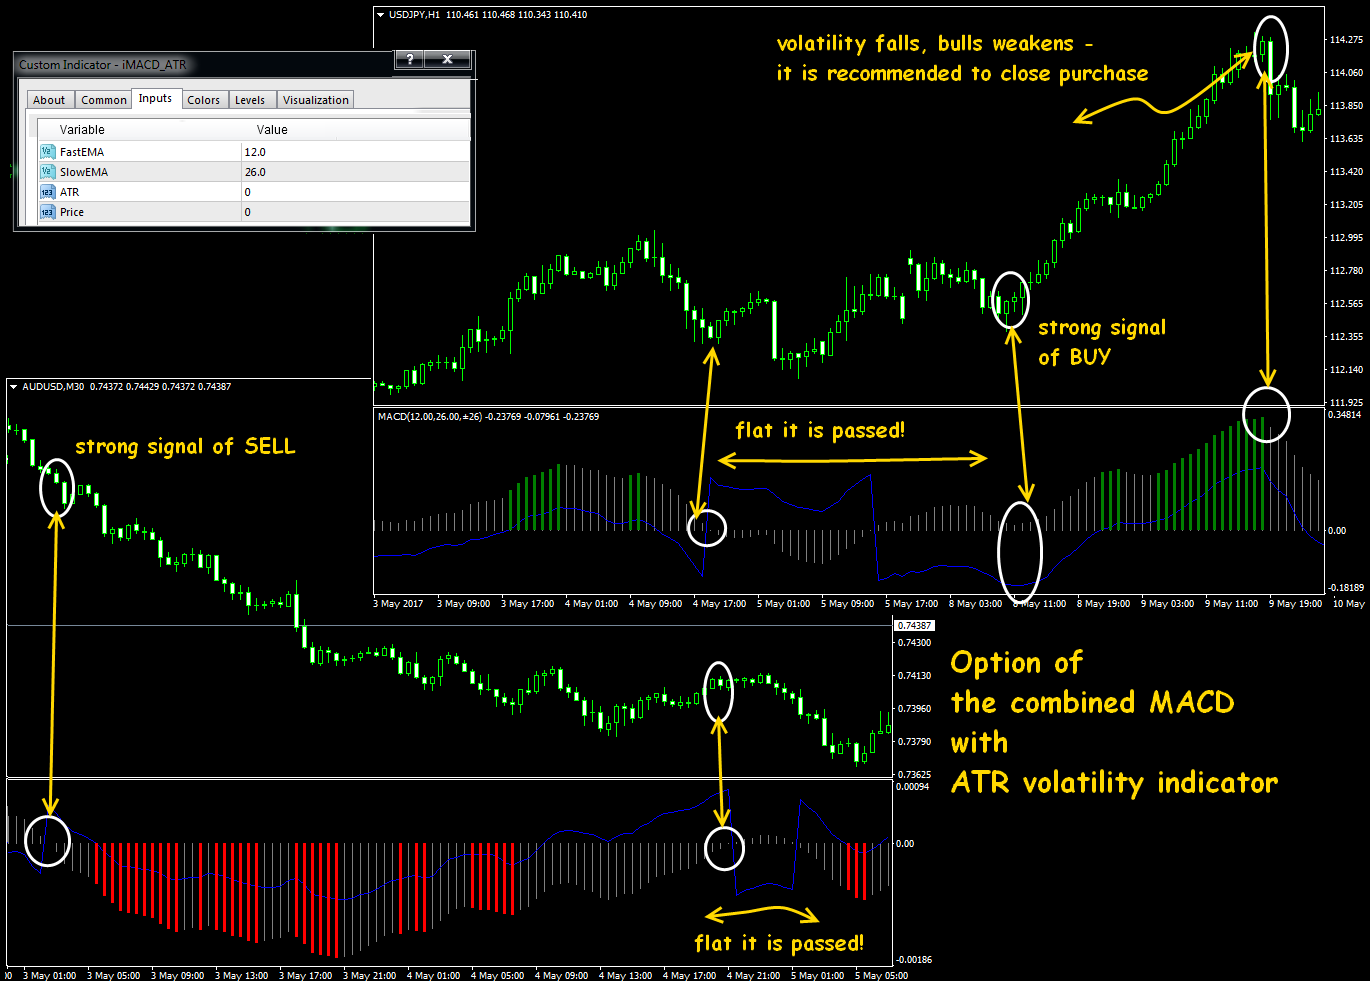
The crossing of the zero line is considered a trade signal. It is meant that color of bars of the chart shows the power of active players, gray color means a decrease of the activity that at the simultaneous falling of volatility is considered a strong signal for the closing of the current position.
And as the conclusion …
The main advantage of MACD that it is a trend indicator. Its signals won't allow you to trade against the strongest movement. Of course, MACD, as well as the majority of indicators, is intended for the technical analysis on big time frames (not below H4), on younger time frames quality of signals is much lower.
Lack of the MACD indicator that it is a trend indicator. 75-80% of trade time the market are in a flat (of different range) and an opportunity to trade on a reliable signal of MACD appears rather seldom. Especially as gives many false signals in lateral motion.
Each trader, irrespective of the strategy he trades, has a main problem: a lack of patience − it is difficult to wait for all conditions for the opening of the transaction and achievement of target levels. For this reason, the MACD indicator is ideal for beginners. Yes, it is late, but it gives time in addition to estimate a situation.
Thanks to a combination of properties of the trend indicator and oscillator, they continue to create trade systems on the basis of the MACD indicator, but it is impossible to use it without additional filtration of signals. The applying of it on assets which are defined as steady trends is the most effective, but divergence remains its best signal.
Classical MACD has sustained check time and successfully adapts under various trade conditions. It gives a set of different signals – for every taste, but the most important – the MACD indicator always reflects a real situation without redrawing.
Social button for Joomla