

")
We offer those who loves graphical creations the facilitated option of wave trade quite available to beginners both by the level of knowledge and a deposit amount. Especially as even the experienced traders who are constantly practicing the wave analysis consider joint combinations of Woolf's Waves and Elliott’s Waves rather effective.
The fractal theory of the markets successfully combines the idealistic Dow theory with the mathematical idea of the cyclicality of any processes. In the technical analysis, it is realized in the form of the estimation of the price for graphical wave patterns of different scale. On our website, you can find a detailed description of global wave model and its psychological component.
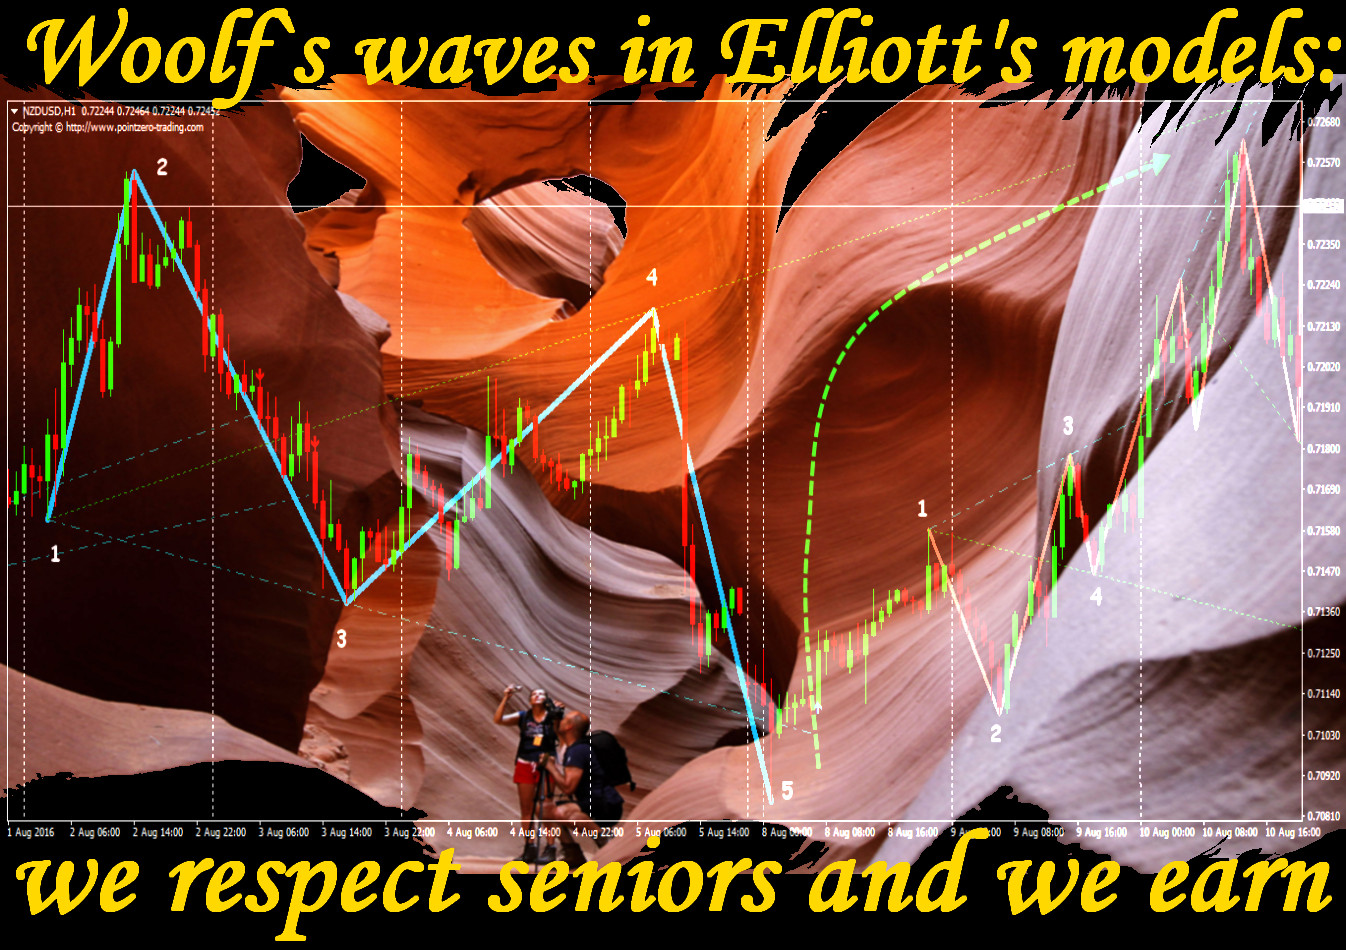
Modern financial flows quite correspond to the Newton`s first law: on each action the market offers counteraction, adequate on force. The goal of Woolf's Waves is «to catch» short-term opposite reaction – they are a little shortened wave patterns which the main benefit in an availability to make the basic main analysis and determination of points of an entrance and exit on one (current) time frame, and the additional marking on the big or smaller periods – is optional. But who wants to be sure of a trading signal – such additional analysis is recommended.
Let's a little remember the theory
The wave theory of the financial markets is the global idea of the cyclicality of any human activities combined with the market Dow`s theory and fulfills the estimation of the further behavior of the price taking into account psychology of market behavior. It is meant the wave structure is inherent to any trade asset, to the obligation or the share, and the market is a product of mass human psychology. Elliott's waves need to be perceived as a display of actions in the market of opposite forces of creation and destruction reflecting the result of emotions of the market participants – the way from hope for profit to fear of ruin.
The cyclic tendency consists of 8 waves: 5 waves of the main movement and three subsequent waves of correction («5+3» wave model). This model is a complete trade cycle and has the property of fractality, so it is a component of the same «5+3» wave structure of the following level (a bigger time frame).
Psychologically the market argues this way:
Wave 1. «The market mentality» is completely negative (bear). Very strong movement is usually observed.
Wave 2. The market sharply rolled away from profitable levels – desires of investors to fix profit dominate.
Wave 3. Sharp growth of optimism (of investors), the prices are accelerating, amounts grow.
Wave 4. It`s very difficult for exact identification in reality. Optimism is still in the market, but − weakens.
Wave 5. The increase in prices in case of the average trading volumes is observed. Mass agiotage. There is a sharp throw of amounts at the end of a wave.
Wave A. Most of the participants are still sure the growth will continue with a new force but doubting already appear.
Wave B. Means weak movement up (residual optimism).
Wave C. The strong descending wave against the background of general confidence the new wave begins but is already careful purchases.
The modern view of the base «5+3» wave model is below, the waves are marked by figures and letters.
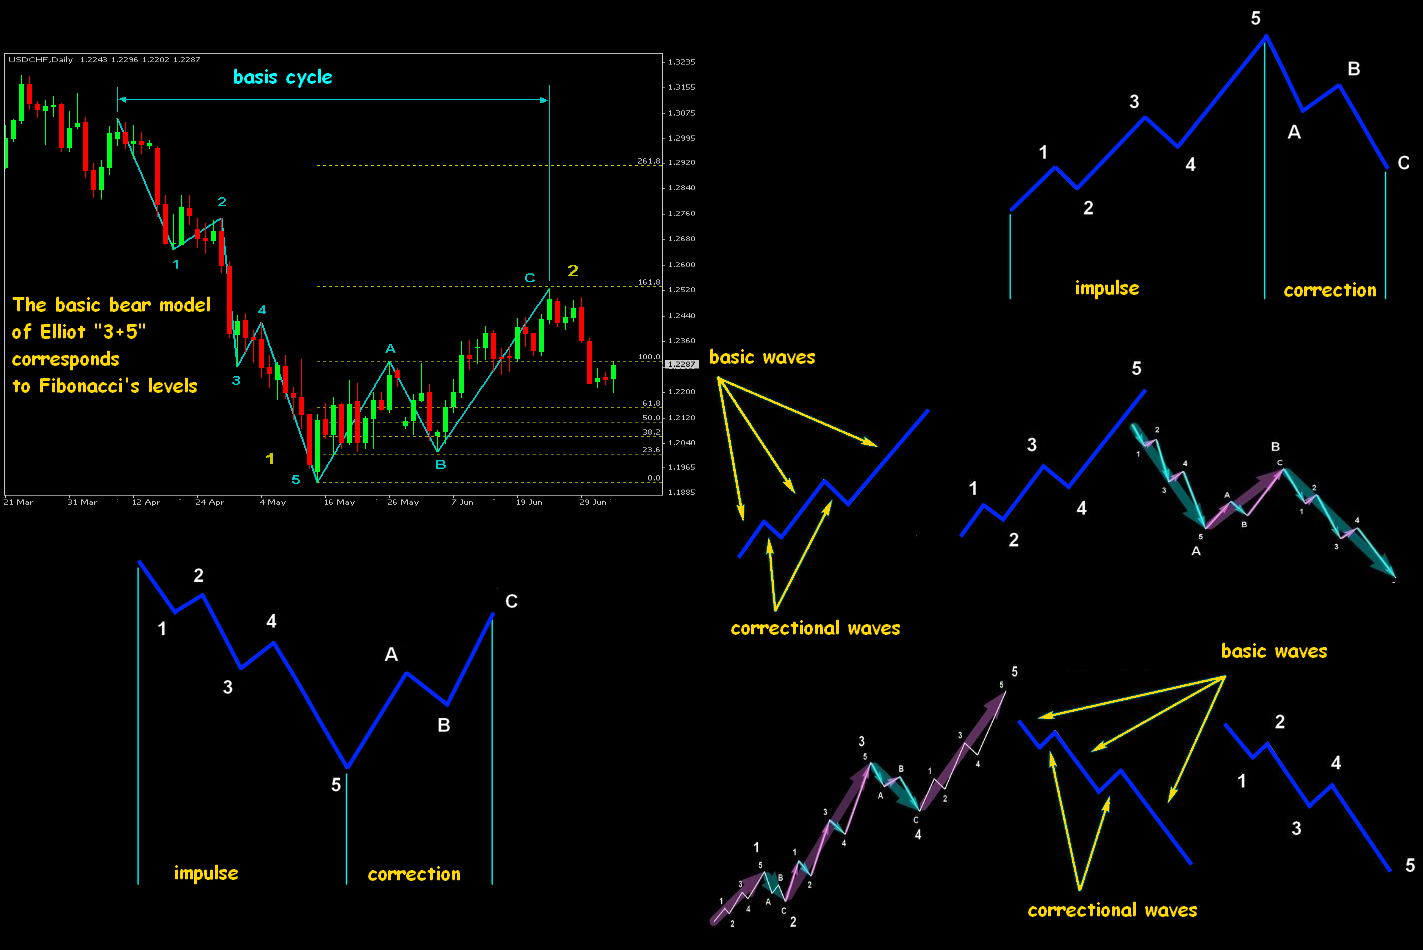
1-3-5 waves call pulse, 2-4 − adjusting. A, b and c sites are always moving against the main tendency 1-5, which can be growing or descending.
Pulse waves have some properties which violation isn't allowed.
1. The end of the 2nd pulse wave doesn't come for the beginning of the 1st wave.
2. In the case of development of a strong impulse, the end of the 4th wave doesn't come for the end of the 1st wave.
3. The maximum amplitude belongs to the 3rd wave.
In practice, wave market movement can last from several minutes or hours to several years and decades. If a violation of these principles happens, you should review results of the analysis and begin to search another wave model.
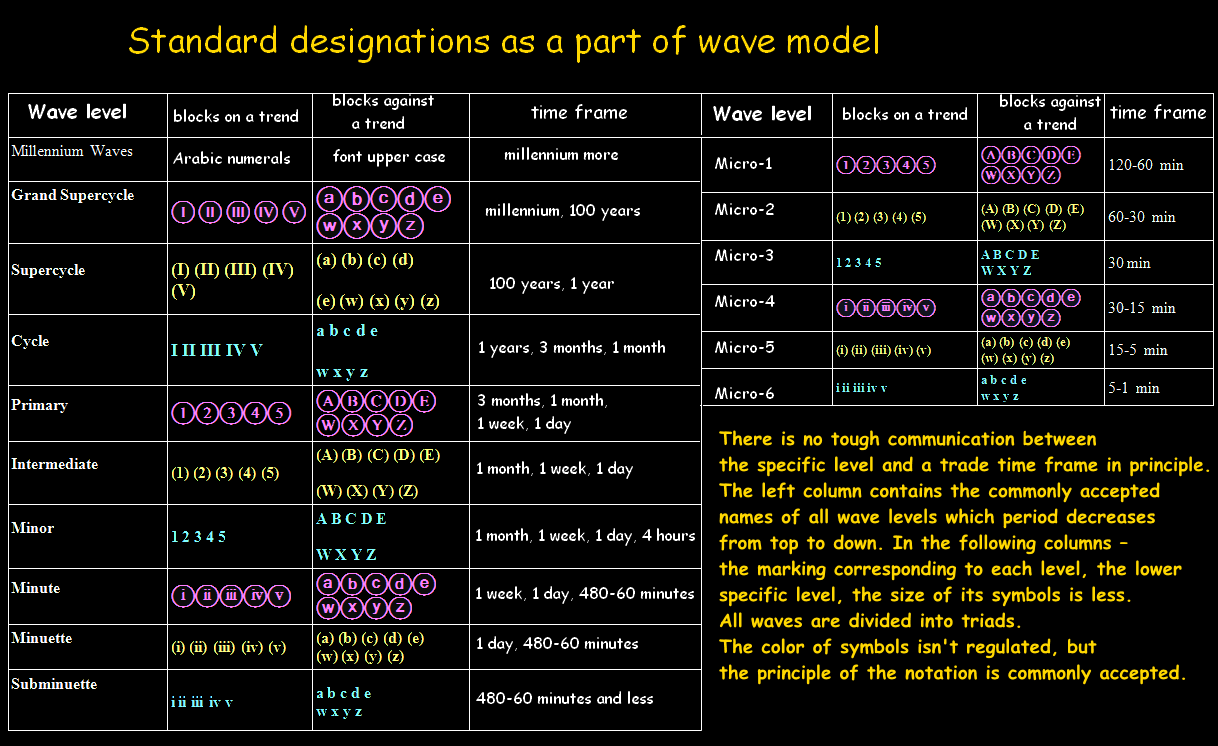
Except for professionals of the wave analysis, we will risk reminding the main designations, and also the basic principles of application of a trading technique on Woolf's Waves.
There are only two basic constructions - for ascending and for falling market – they consist of a set of multidirectional waves, each of them is marked with the figure. The reference mark in a point 1, any significant (on this time frame) extremum (maximum/minimum) is a point 2. The model is a continuation of a wave 1-2. At the same time, an exit out of the level of the first point (above or below) shall be fixed. Until this condition is satisfied – this scheme isn't considered Woolf's Wave.
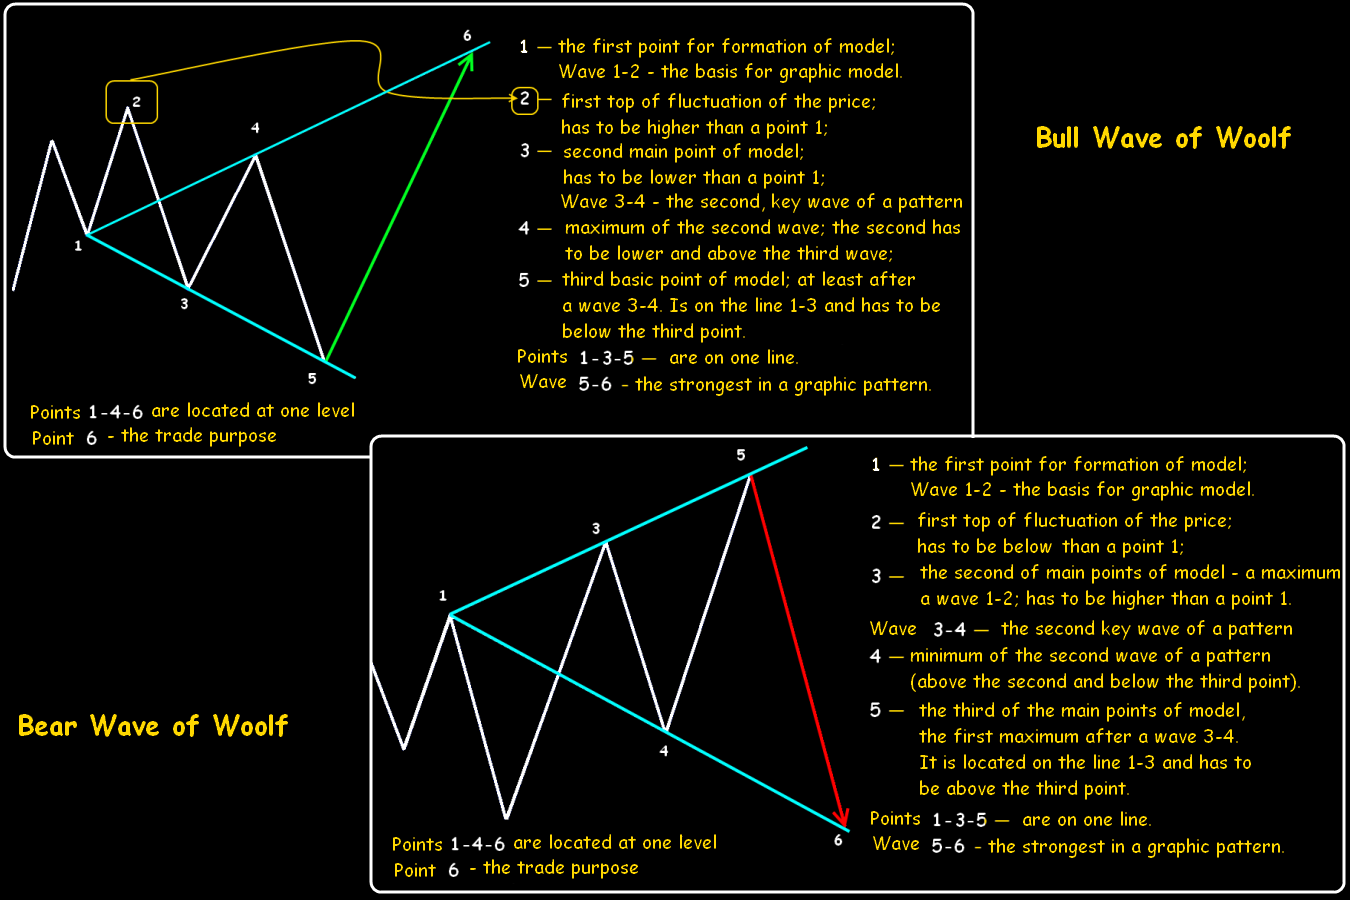
According to the theory we «identify» Woolf's Wave only if 1-2-3-4 waves are accurately created and you can draw two basic lines rather precisely: 1-4 line (on this line the ultimate trade goal – a point 6 will be located subsequently) and 1-3 line which will show the level of completion of a wave 5 and the beginning of a wave 6. The wave 5 sometimes can break this line or not reach it.
Target point 5 will be the point of entry and the entire period of transaction keeping shall be placed on a wave 5-6, but before you should receive a sure signal for this «wave». The regular moving average rather its breakthrough will suit, and the period shall be such that the line of the indicator acted as support of a wave 5. Also, you may use the regular trend line on maxima of a wave 5, or any candle model of a turn at the end of a wave 5 (for instance, on the line 1-3).
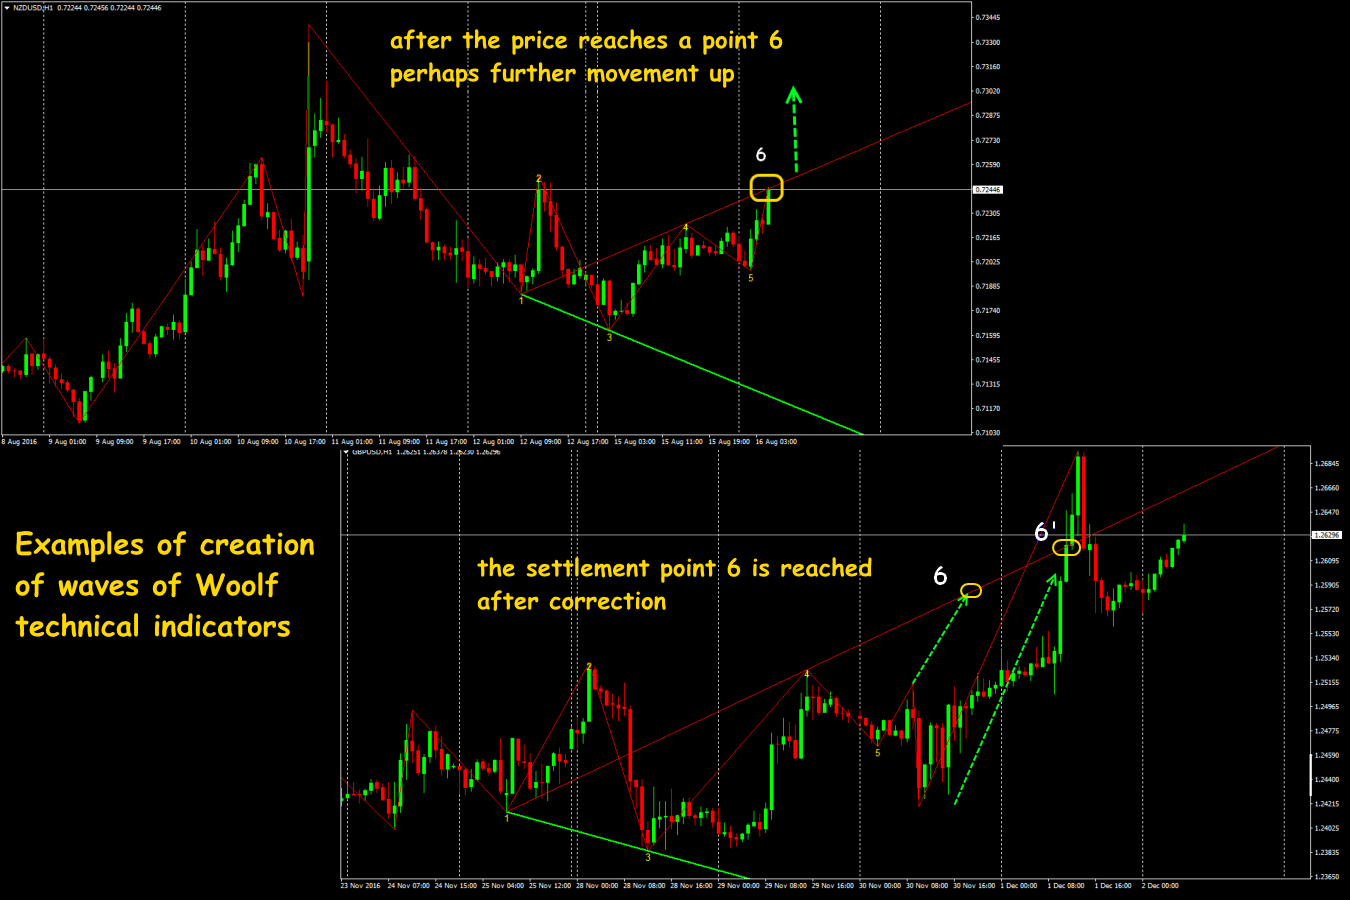
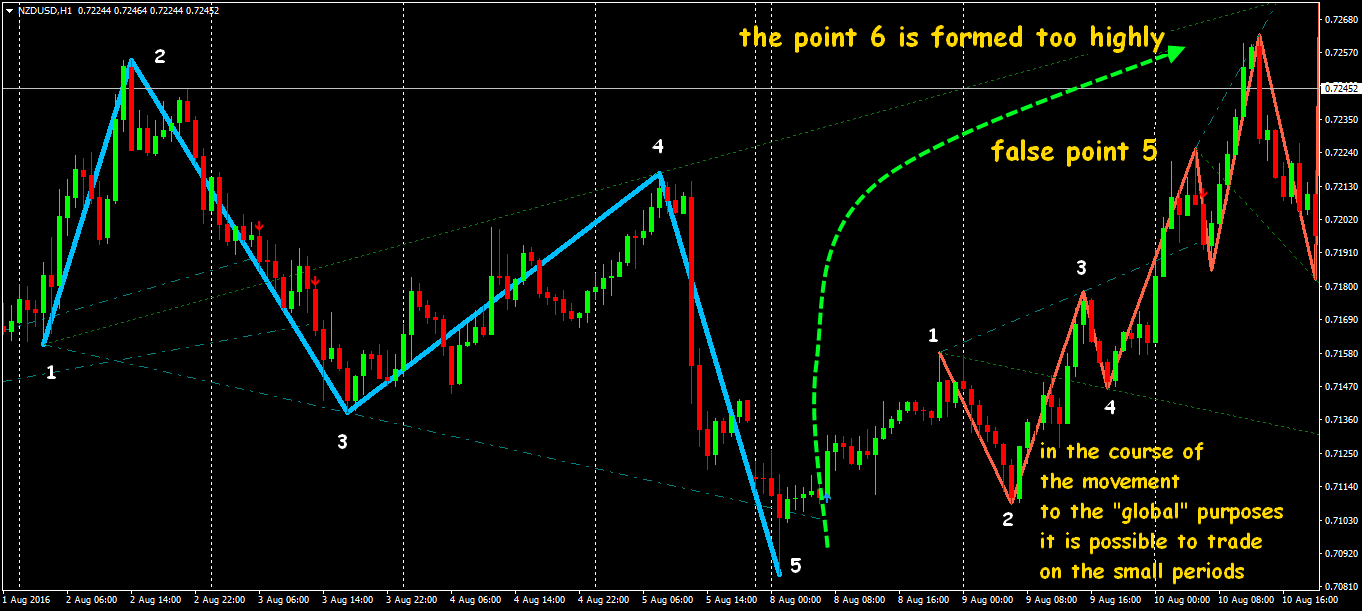
After forming of a point 5 the market can «go» to correction, but then turn in the settlement direction and nevertheless to fulfill a point 6, however, slightly displaced. After the price achieves settlement point 6, the pattern is considered fulfilled and all transactions shall be fixed. However, marking lines of the Woolf`s Wave are strong dynamic levels of support/resistance, that is in the case of their breakthrough usually profitable movement continues.
If there is a sufficient experience, you can mark waves manually, but there are technical indicators with fine turning today which will make all constructions automatically and will modify on the current situation.
Few practical notes
As well as in the majority of wave constructions, rather big percent of the constructed models disperses from the real market, therefore, additional filters are obligatory for confirmation of model. It can be Fibonacci`s or Murray's levels, candle models or Elliott's Waves.
Certainly, as any patterns of the wave analysis, we look for Woolf's Waves on the time frames, not below H1.
A point 2 is the main filter in the Woolf`s model: if within some time scale it is rather significant extremum, the probability of fulfillment of model increases. The corner between lines 1-4 and 1-3 is also important for the estimation of the stability of model: the corner 40-45° or slightly more is considered as optimum. If the corner is less than 40 ° − trade on this model isn't recommended.
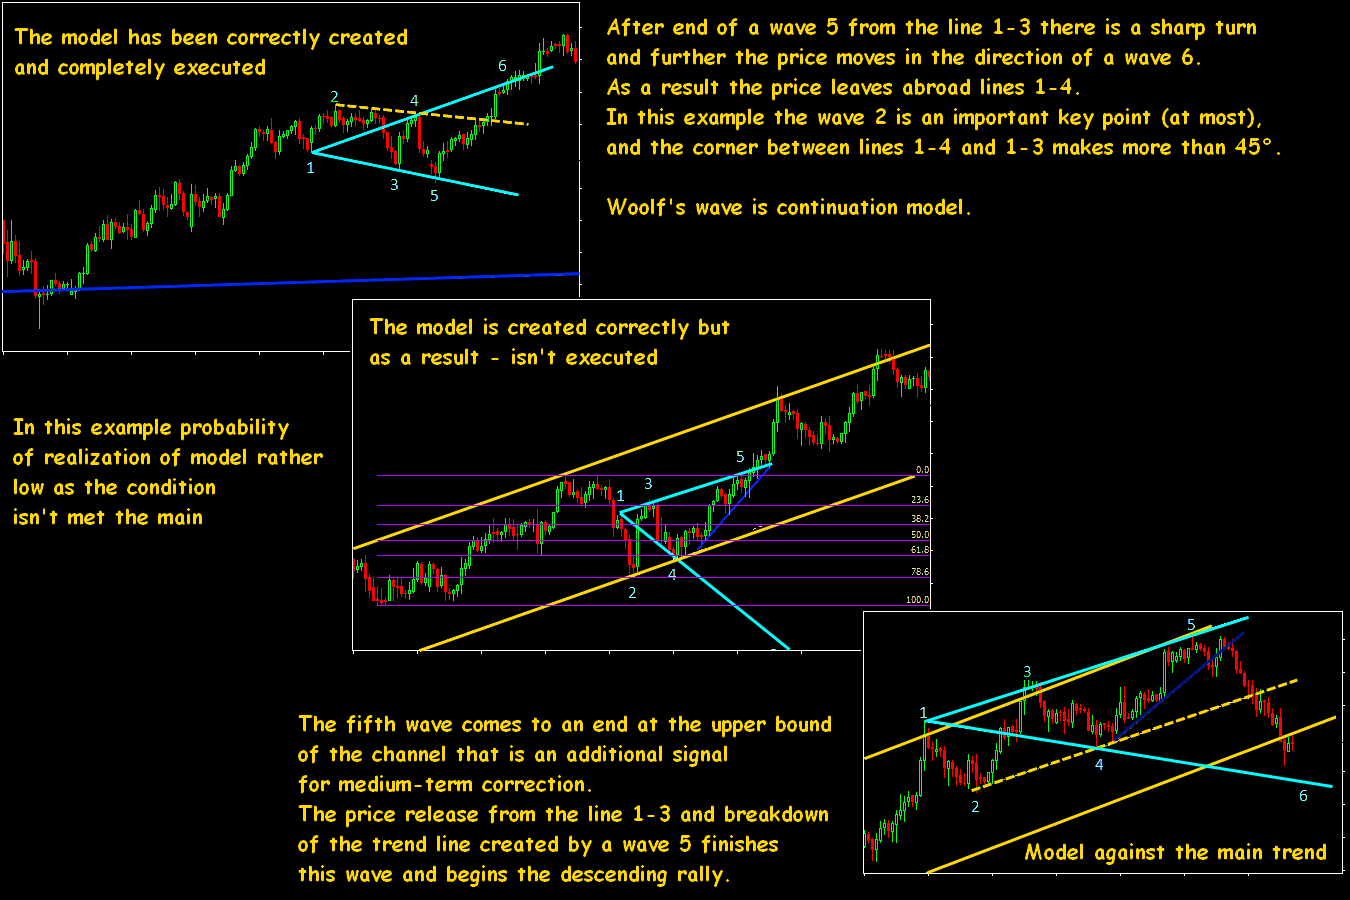
In the second option everything looks fine, but on a number of signs, it was possible to assume the fulfillment of model is improbable. In this structure, the wave 2 is a strong minimum, but if to add the additional filter, then you may see it`s completed at 78,6% Fibo`s level. It allows to consider it as a technical correction and to draw a conclusion that the movement on a trend will be continued further. Also, the unambiguous kickback from the line 1-3 isn't visible (there is no obvious turn). But the most important – the trend line on minima of a wave 5 hasn't been broken – it`s very risky to enter such transaction.
The third option is the successful anti-trend model.
In the case of model creation in Woolf's Waves, an additional sector called by sweet zone may appear. It is a possible zone of the end of the 5th wave. The entrance to the transaction in this zone is the most profitable. For creation, you should draw an additional line between tops 2 and 4, and strictly in parallel to duplicate through a point 3. If the built such line is already parallel to the line 1-3, then in this wave such zone is absent.
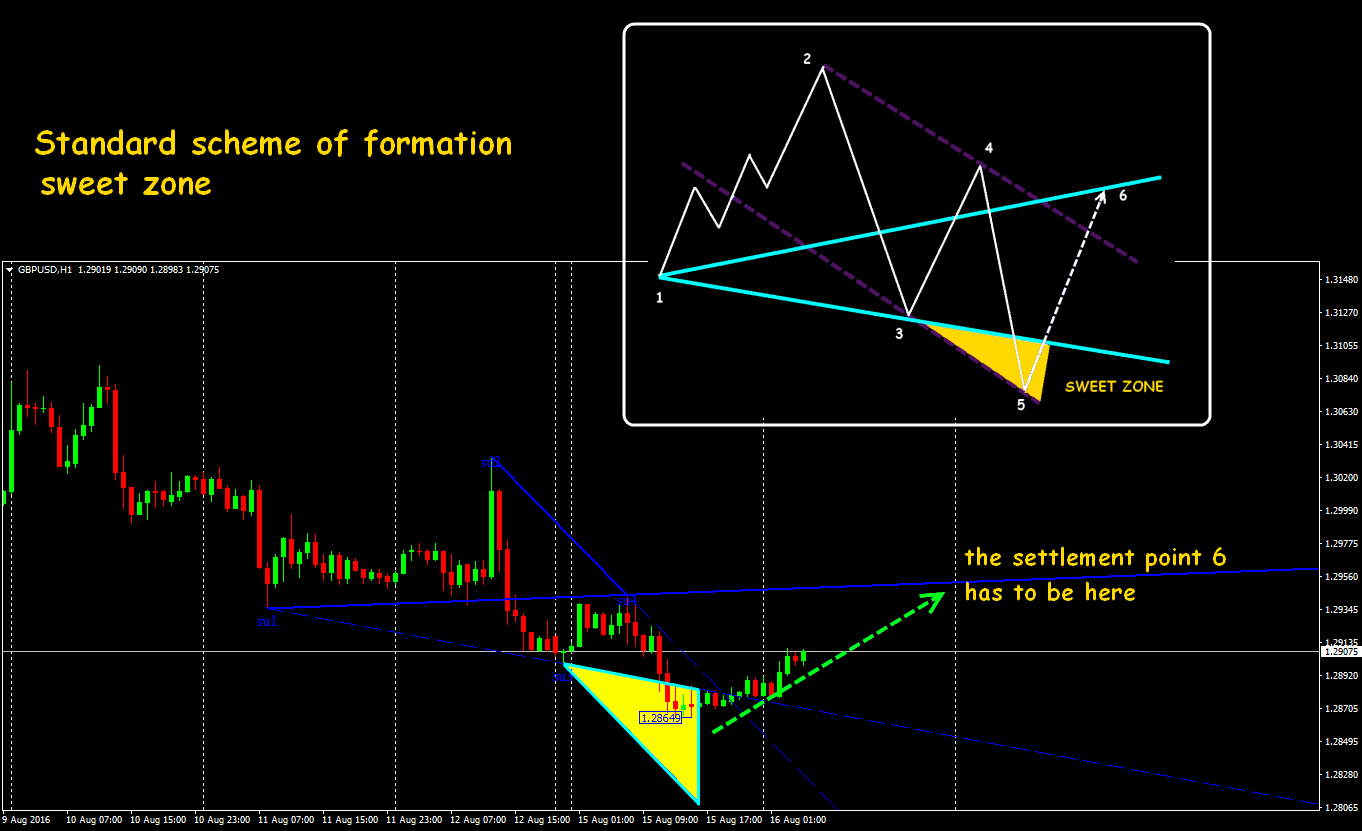
If the built «corner» turns out too «stretched» concerning the line 1-3, then either constructions are executed incorrectly, or this is not a Woolf`s Waves model at all.
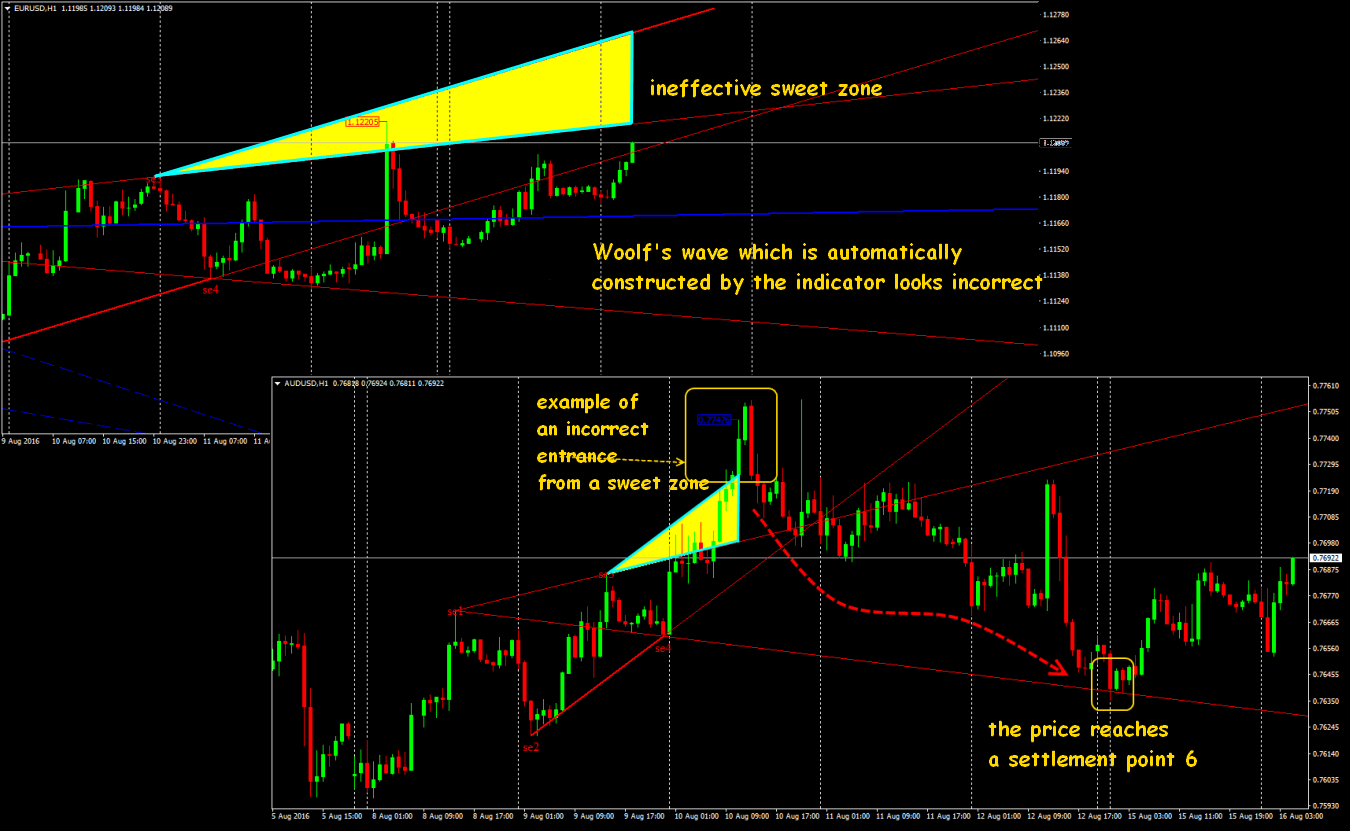
In the case of creation of Woolf`s Waves by technical indicators the necessary zone will appear automatically, but sometimes its bounds are not absolutely correct. In MetaTrader 4(5) and in the majority of the popular platforms a sweet zone may be specified by the Equidistant Channel tool. It is rather risky to open transactions in the sweet zone, but in the case of confirmation, for instance, from strong price level (Fibo, Murray, the bounds of the channel) – it`s quite possible. More reliable entrance is after the return of the price to bounds of the Woolf `s Wave.
The full wave model (EWA) is created long enough so it makes a sense to trade its certain sites. Let's consider several stable combinations where Elliott`s model waves are shown by symbols. We don't forget – the main condition for such analysis is the correct determination of that basic figure «within» which we are going to analyze the behavior of Woolf`s Waves.
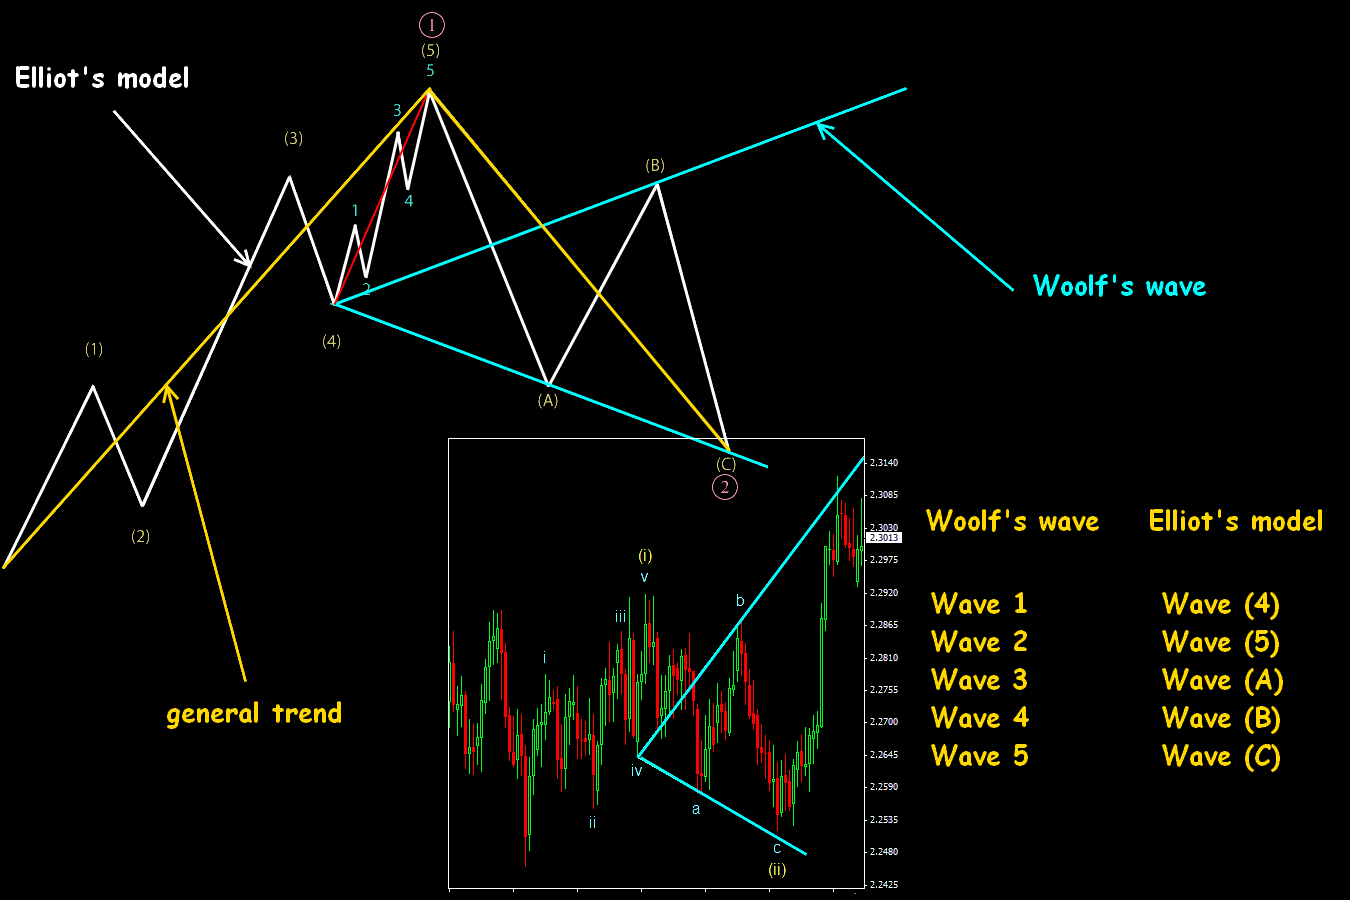
Use of the Woolf`s Wave in a «Zigzag» wave construction
You can try to use Woolf's Waves on a connection of the 1st and 2nd waves of the main wave model. On rather big periods you can «see» the following 3 options of model suitable for use, at least, for medium-term transactions.
Option 1 arises when the fifth Elliott`s wave is formed approximately equal to the first, and the third exceeds the first no more than by 1,618 times.
Option 2 is formed when inharmonious lengthening of the fifth wave is shown. Then the wave (4) or a wave (5) according to EWA will be the first Woolf`s Wave. Further compliance of waves is similarly to the previous case.
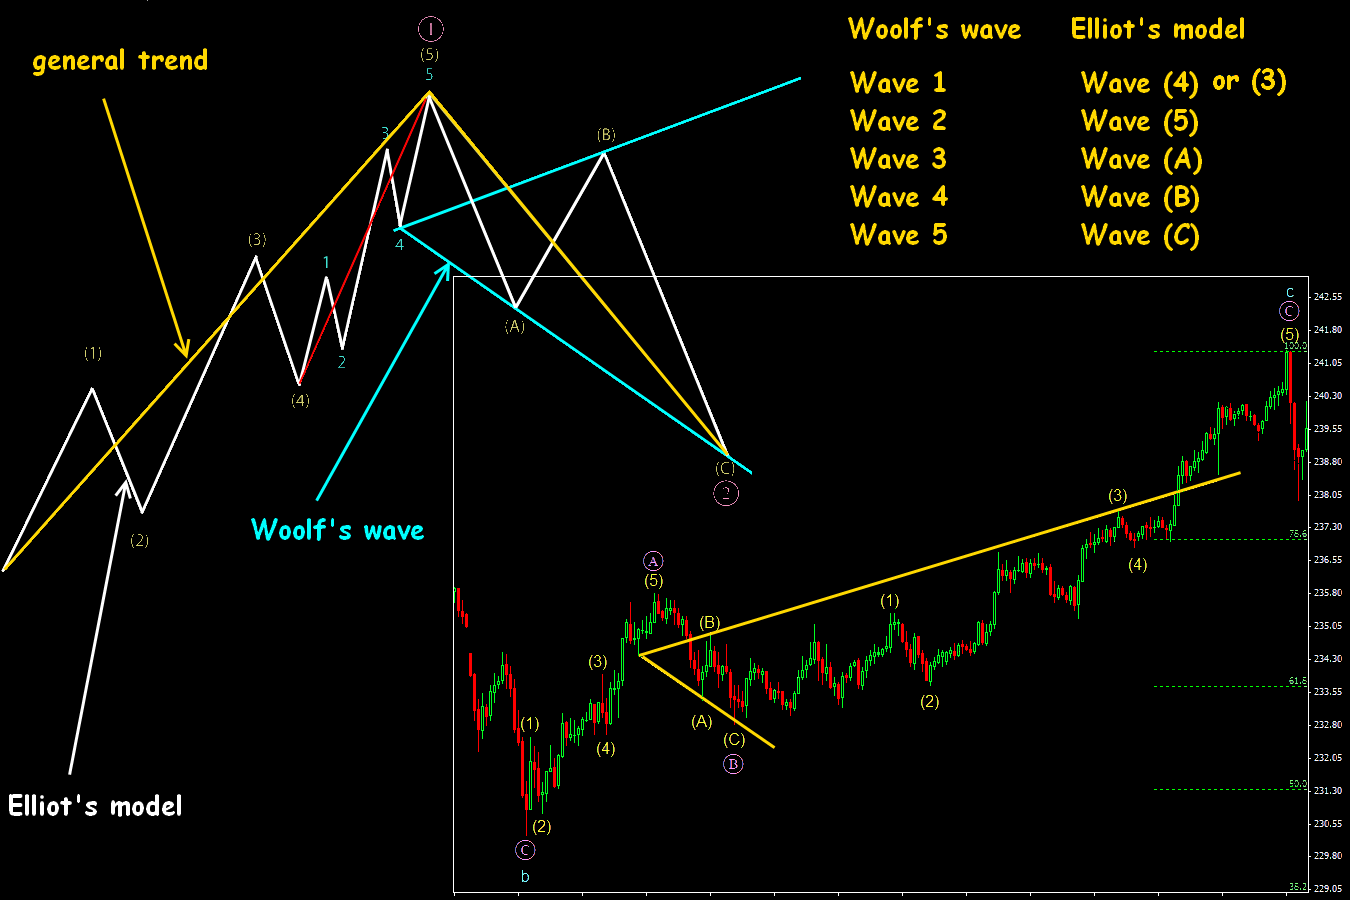
Pay attention: the line 1-4 had rather heavy inclination angle, the wave (3) has been completed just near this line, but the wave (5) has managed to create a new maximum just on Fibo's line and has given the chance for, at least, strong correction.
Option 3 is shown if the third wave is more than 1,618 times longer than the first, and the fifth is significantly less than first or truncated.
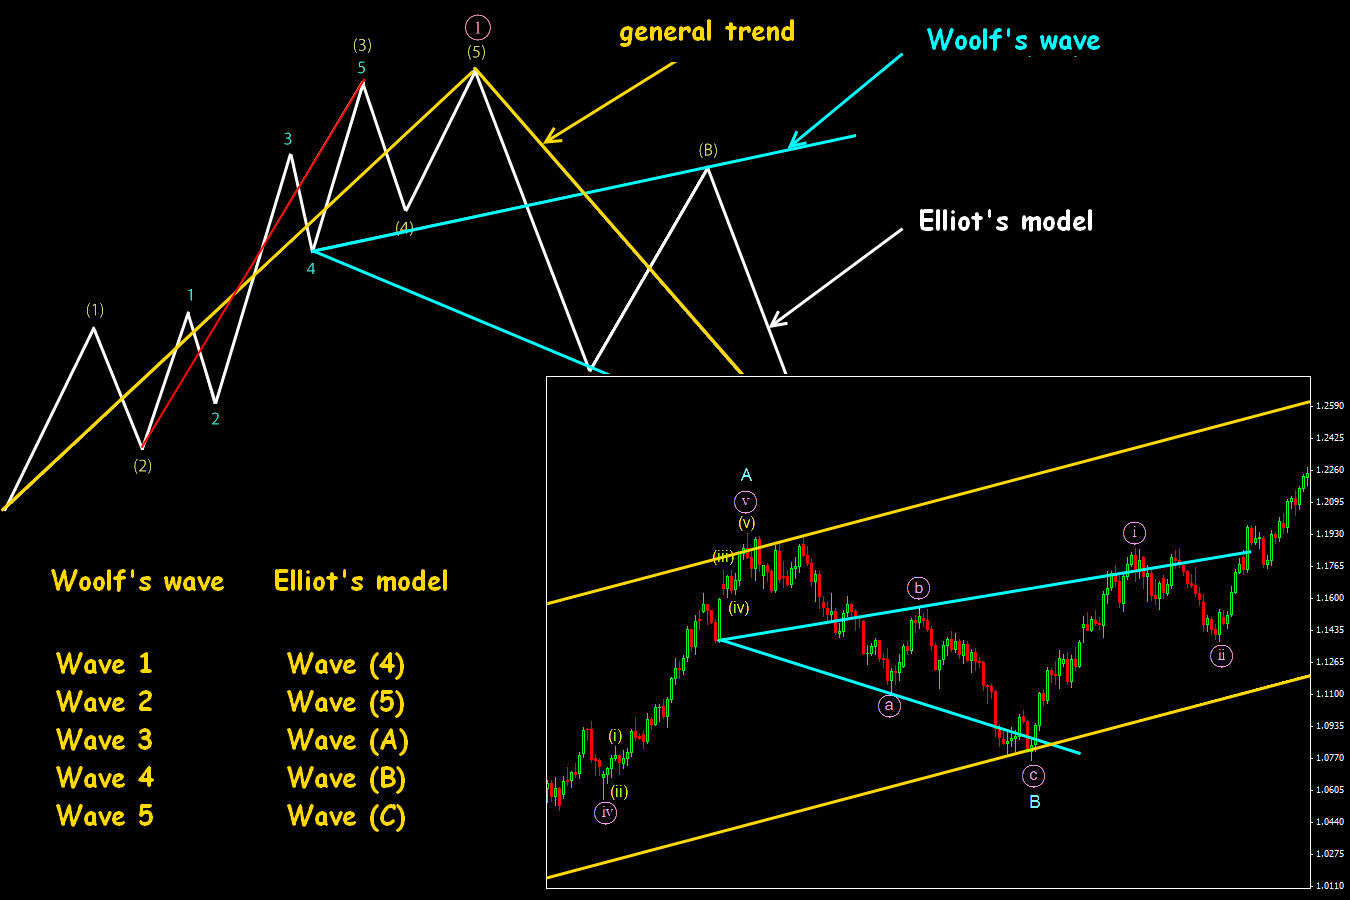
In spite of the wave [i] ended at the line 1-4, the line was broken after the correction and the price went further up.
The offered models, of course, not regularity, but experienced wave-trader «sees» them rather often in the market. In all options, it is necessary the wave (B) exceeded the fourth wave for productive implementation of the model.
Emergence of the Woolf`s Wave in «Double zigzag» wave structure
In general, the working scheme for the main option looks as follows:
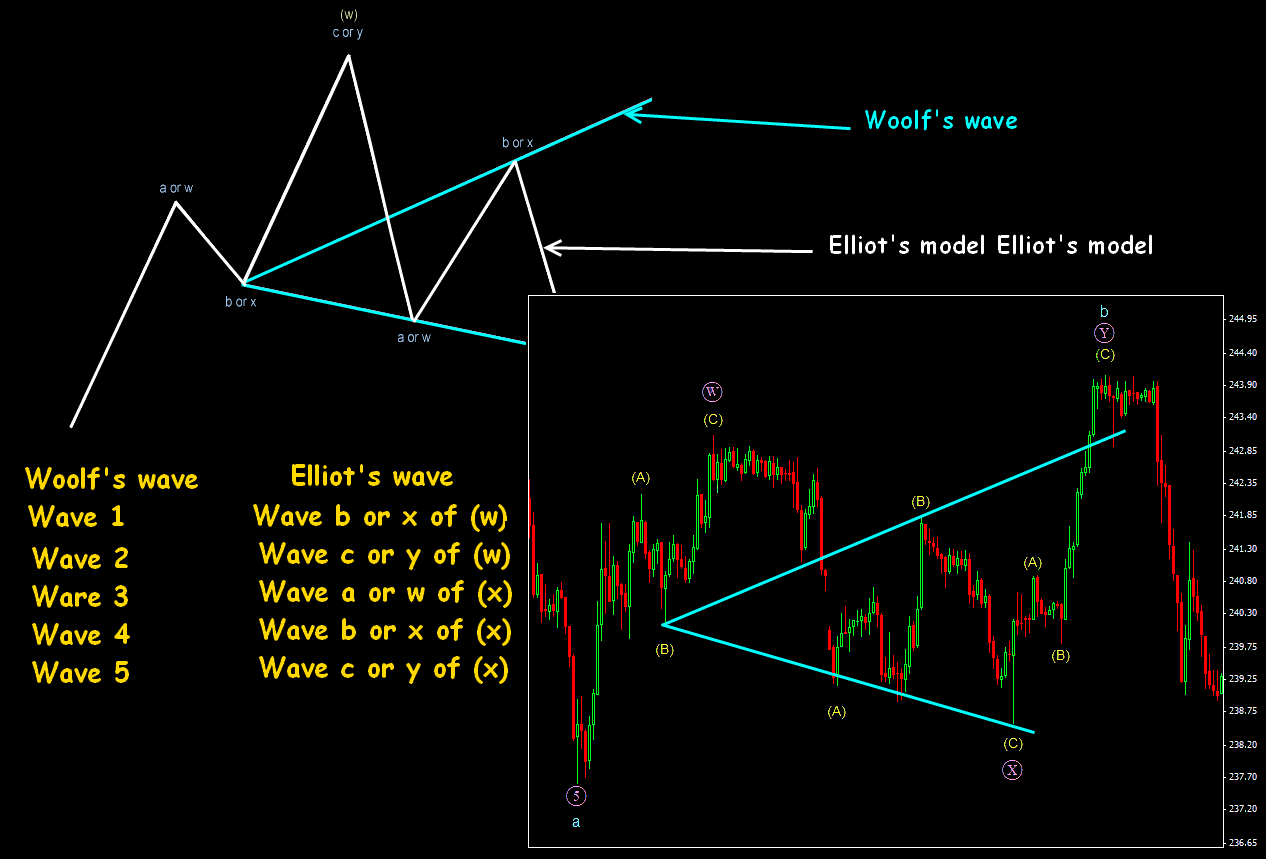
The scheme is effective only if the site [a or w of (x)] breaking through a min of the wave [b or x of (w)], and the site [b or x of (x)] breaking through a wave [b or x of (w)].
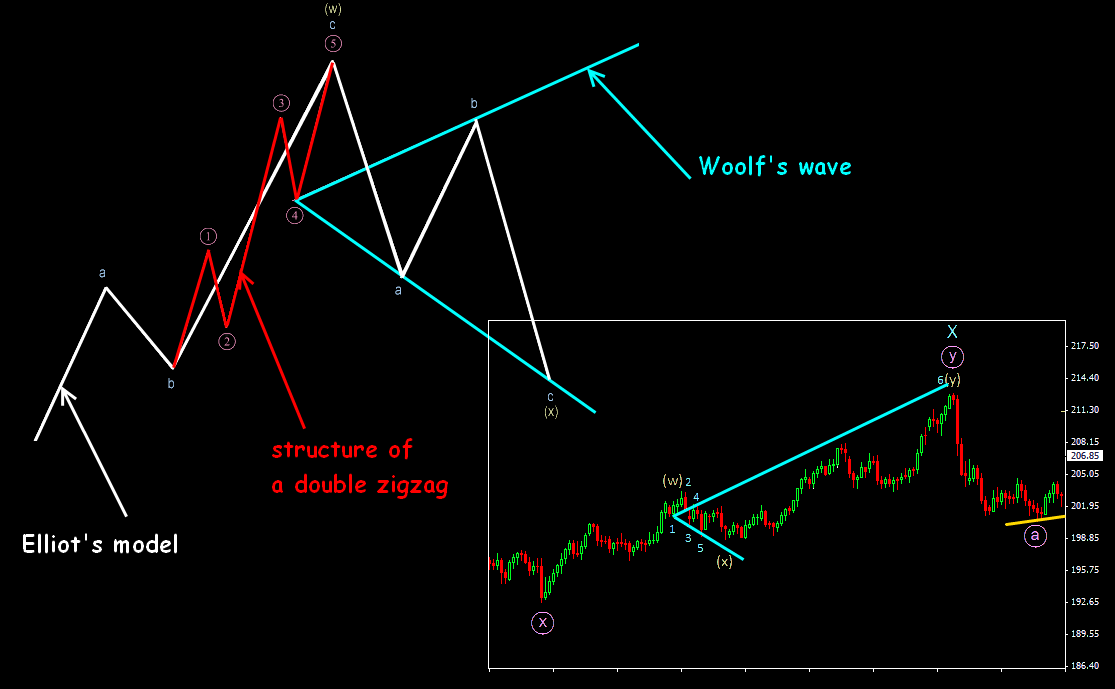
Second option: the internal wave (w) can play a role of the regular zigzag site, and maybe a double zigzag. Woolf's wave will be created in the case if the wave [c or y] is more than wave [a or w] in the structure of a wave (w). The scheme a wave (w) – a zigzag, and structural waves are the impulses, then the wave [4] will be the first point, is shown below. The wave 6 doesn't reach the line 1-4 a little, but in general, the model is fulfilled.
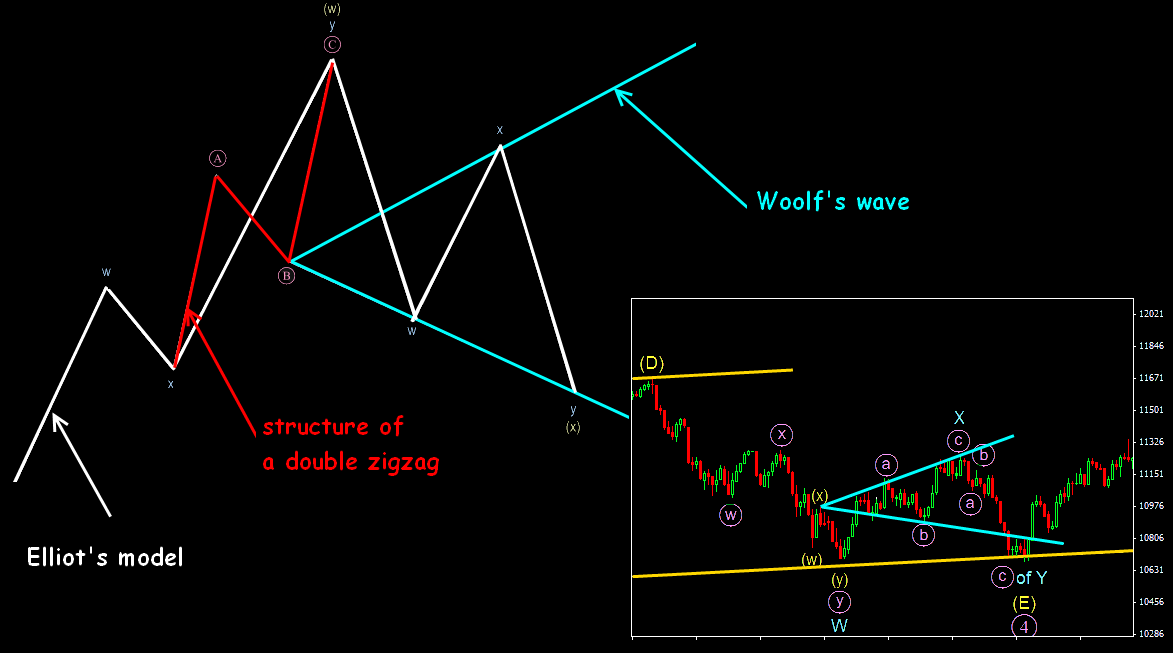
The case when the wave (w) is a double zigzag then a wave [B] or y of (w) will be the first point in Woolf's Wave. Other points are identical. On an example end of the Woolf`s Wave (i.e. the sixth point) goes beyond the line 1-4 a little and is a wave [c] of y.
Use of Woolf`s Waves in the Diagonal Triangle model
The diagonal triangle in a wave (5) of [3] is shown below on the scheme, and Woolf's Wave is designated by two main lines. Numbering is identical: the wave 1 according to Woolf corresponds to a wave 1 according to Elliott.
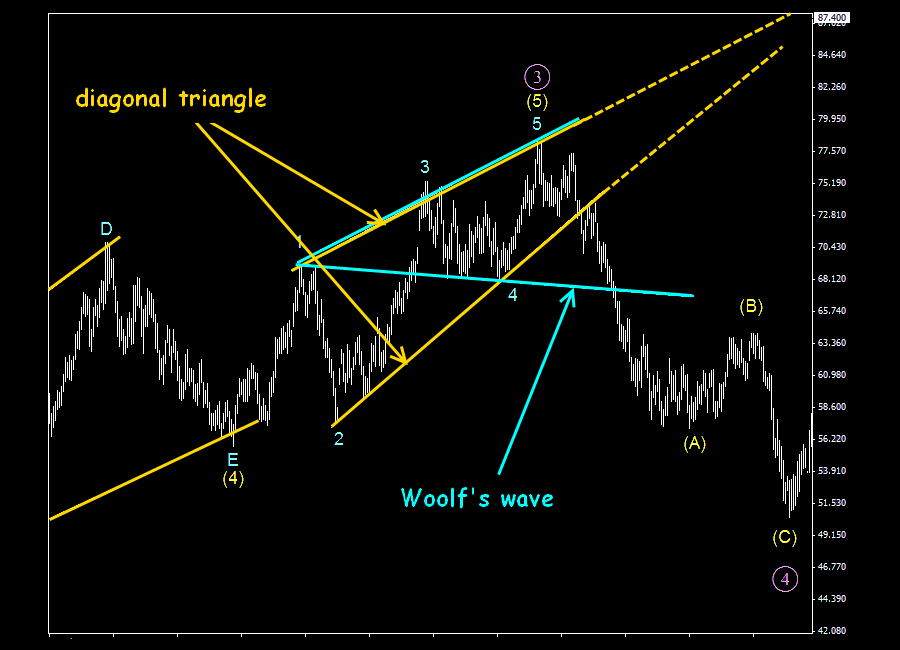
Most often the 6th Woolf`s Wave breaking through a base line 1-4 because it is created in a wave (5) of [3], and the general correction − a wave [4] − is calculated on all amplitude of wave movement [3].
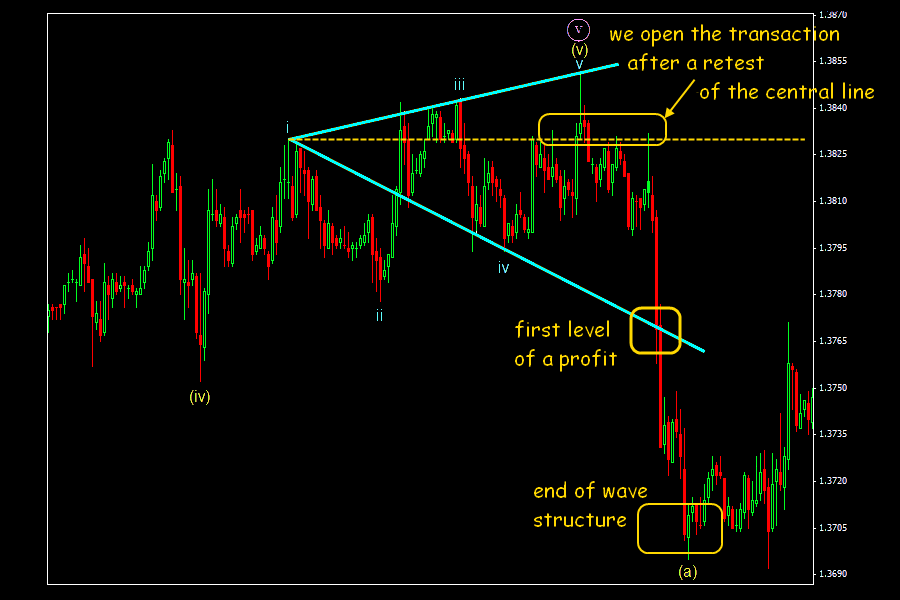
In general, the angle shall depend on correction depth on a wave 4: the more amplitude of the 4th wave, the more will be slope angle of the line 1-4 which is the completing, 6th wave according to Woolf.
The line on waves 2-4 belongs both to Woolf's model, and to the initial diagonal triangle (on EWA), and play a role of the lower basic line of the model. Its breakthrough will give a signal on sale/purchase according to both methods of the analysis.
Application of Woolf`s Waves in the «Inclined Triangle» model
Such situations on Woolf's Waves arise often, give a lot of options because key waves of the main EWA model can be different in the direction, length and amplitude, but anyway, the resultant sixth point shall be a point E of the constructed inclined triangle.
As a rule, in the real market, it took some time to distinguish an inclined triangle (it still call directed), especially, when the structure of the senior level is a correction. Then emergence of the Woolf`s Wave can simplify understanding of a wave picture in general.
On the first scheme, the wave E goes beyond the line 2-4 of Woolf`s Wave and reaches the lower bound of a triangle (the line on waves a and c).
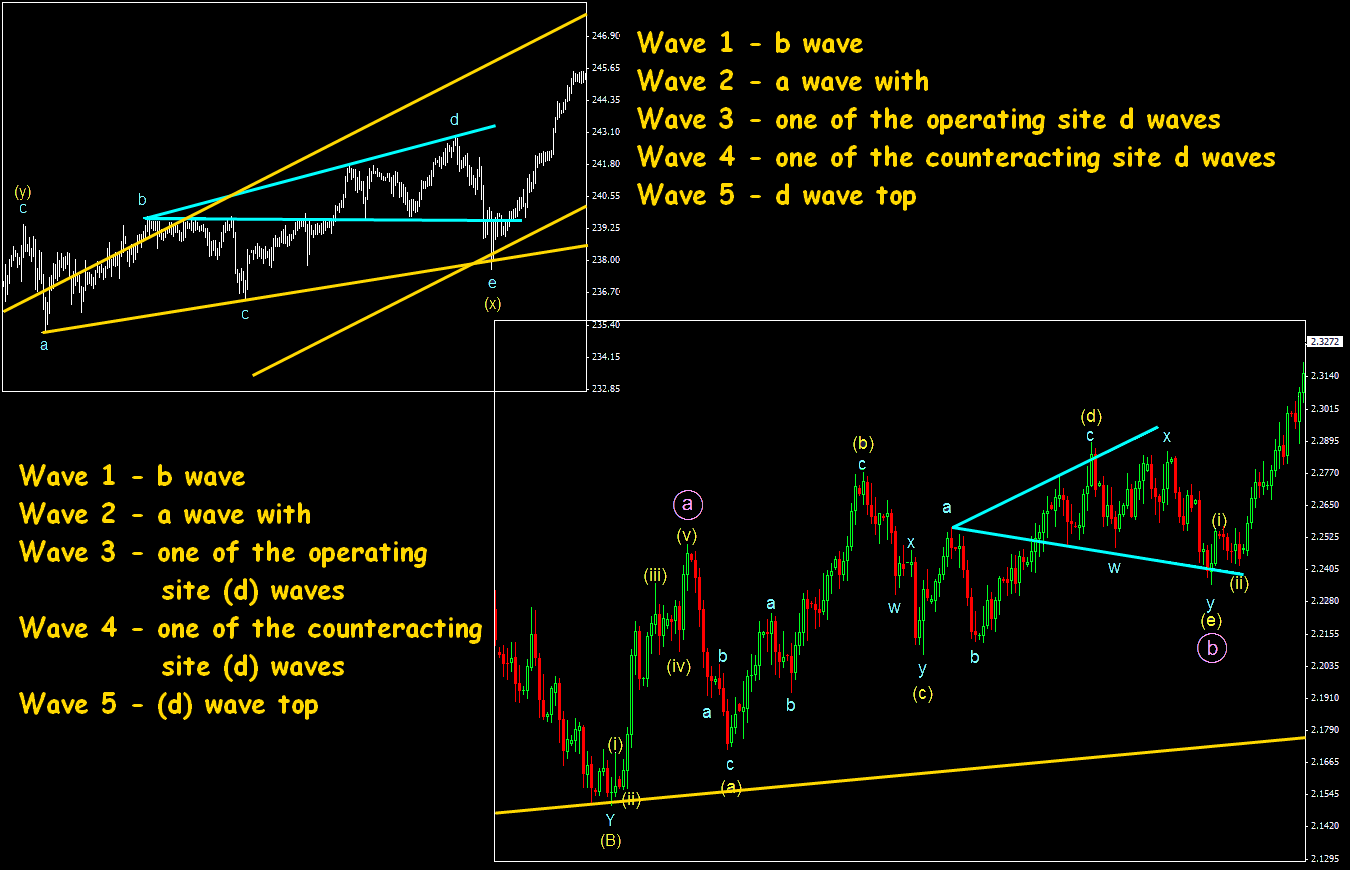
There are essential differences on the second example. Woolf's wave managed to be created only in a wave (d) of the triangle structure, but the wave (e) (in the form of a double zigzag) reached the line 1-4 on Woolf's Wave.
In general, using Woolf's Waves, you may determine rather effectively price reference points of completion of a wave E in the inclined triangles.
Examples of standard trade actions by a Woolf`s Waves technique
We look for a point of entry with the purpose to catch either a turn or the moment of completion of corrections. We will remind once again – it is more reliable to trade on a trend. The analysis of a global tendency will be useful right here: it is necessary to understand accurately where we are with the constructed current Woolf`s model within general wave model.
Regular tactics on Woolf's Waves allows several unusual situations.
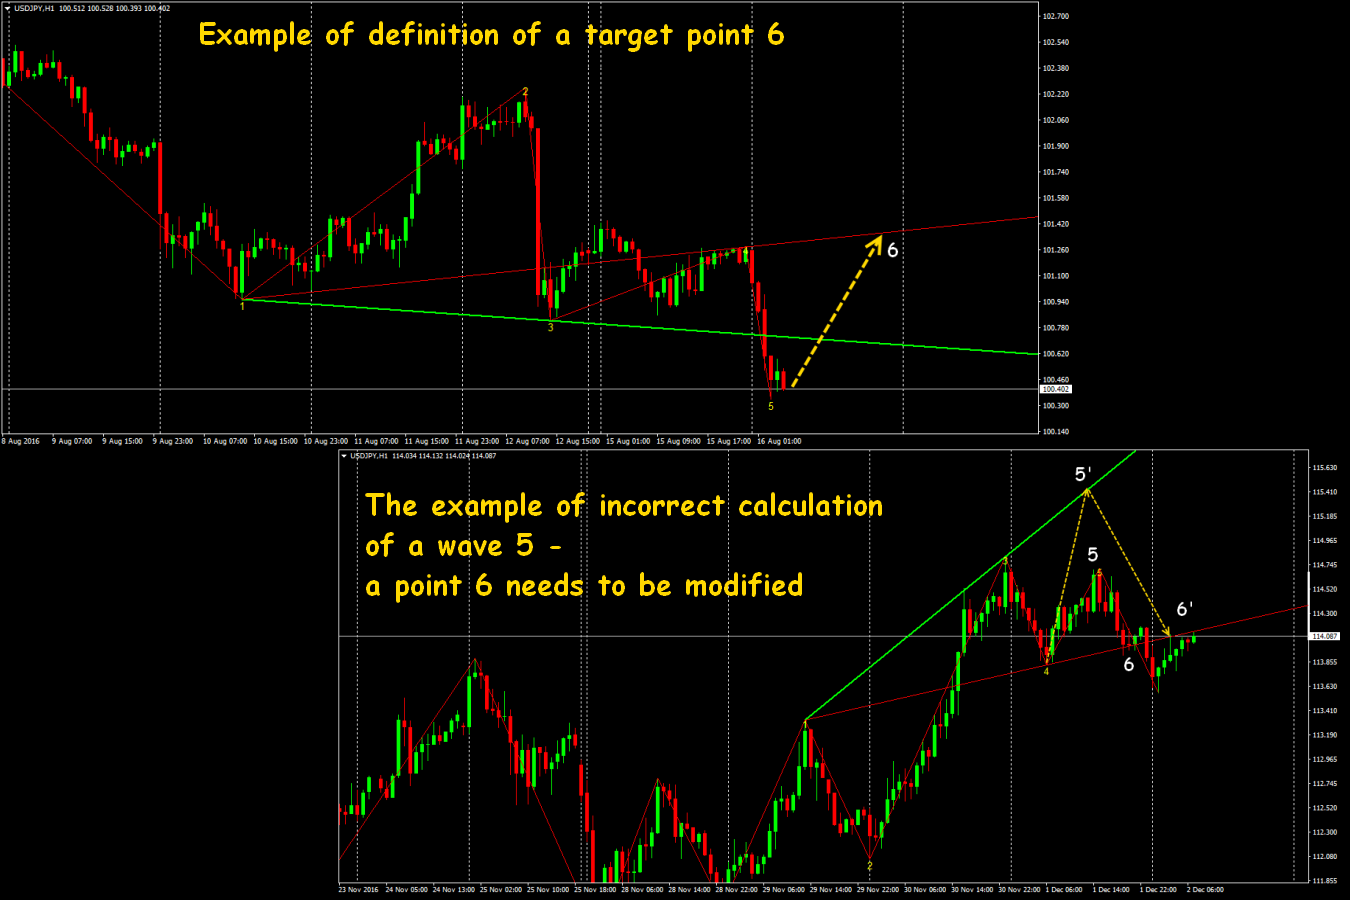
Example 1. The situation when the 4th Woolf`s wave is created in the form of an obvious triangle meets quite often. Because the first peak turns out higher, the line of the purpose 1-4 can leave too far from the current price, therefore, it seems unreal. Most of the beginners treat such models as unfulfilled and refuse them. Nevertheless, the dependences in Woolf's patterns are quite steady and if to risk to draw a line of the purposes only on some key points of such triangle, then the model is normally fulfilled within an acceptable time.
Example 2. One more difficult situation can arise within the development of a wave 6: the price reaches the average line of the purposes, then the market begins to be adjusted without the visible purposes. In such cases, we try to transfer transactions in the black and further, we just wait, either the model will be canceled, or the price will reach the extreme line.
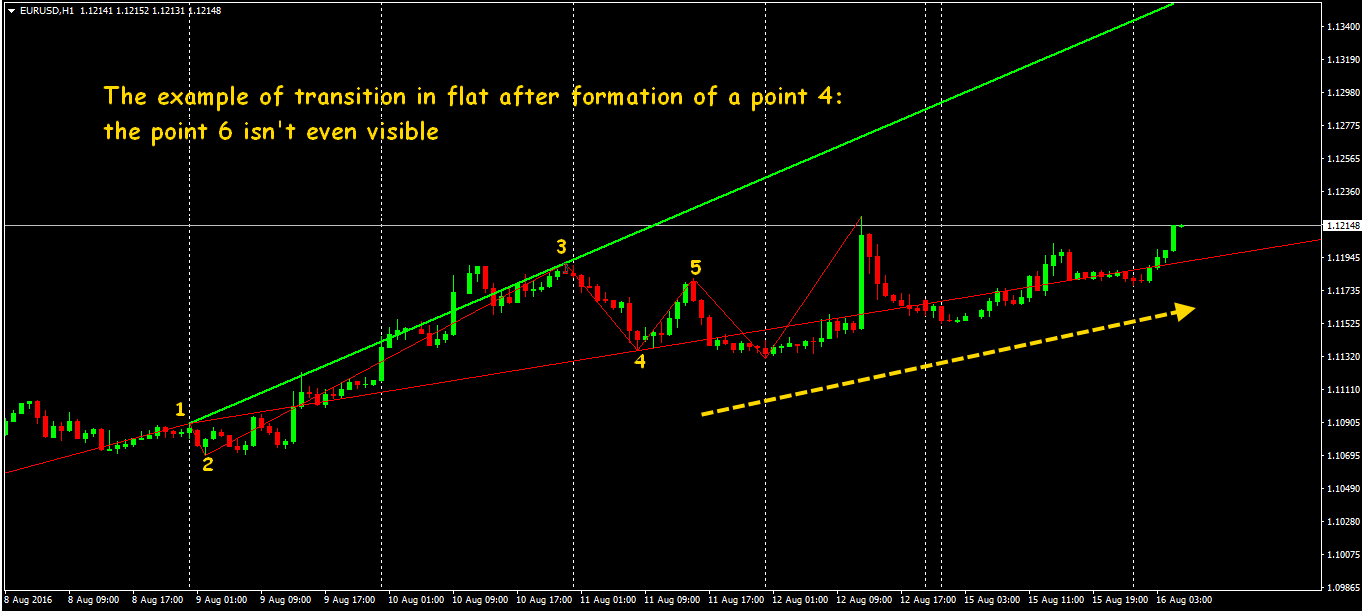
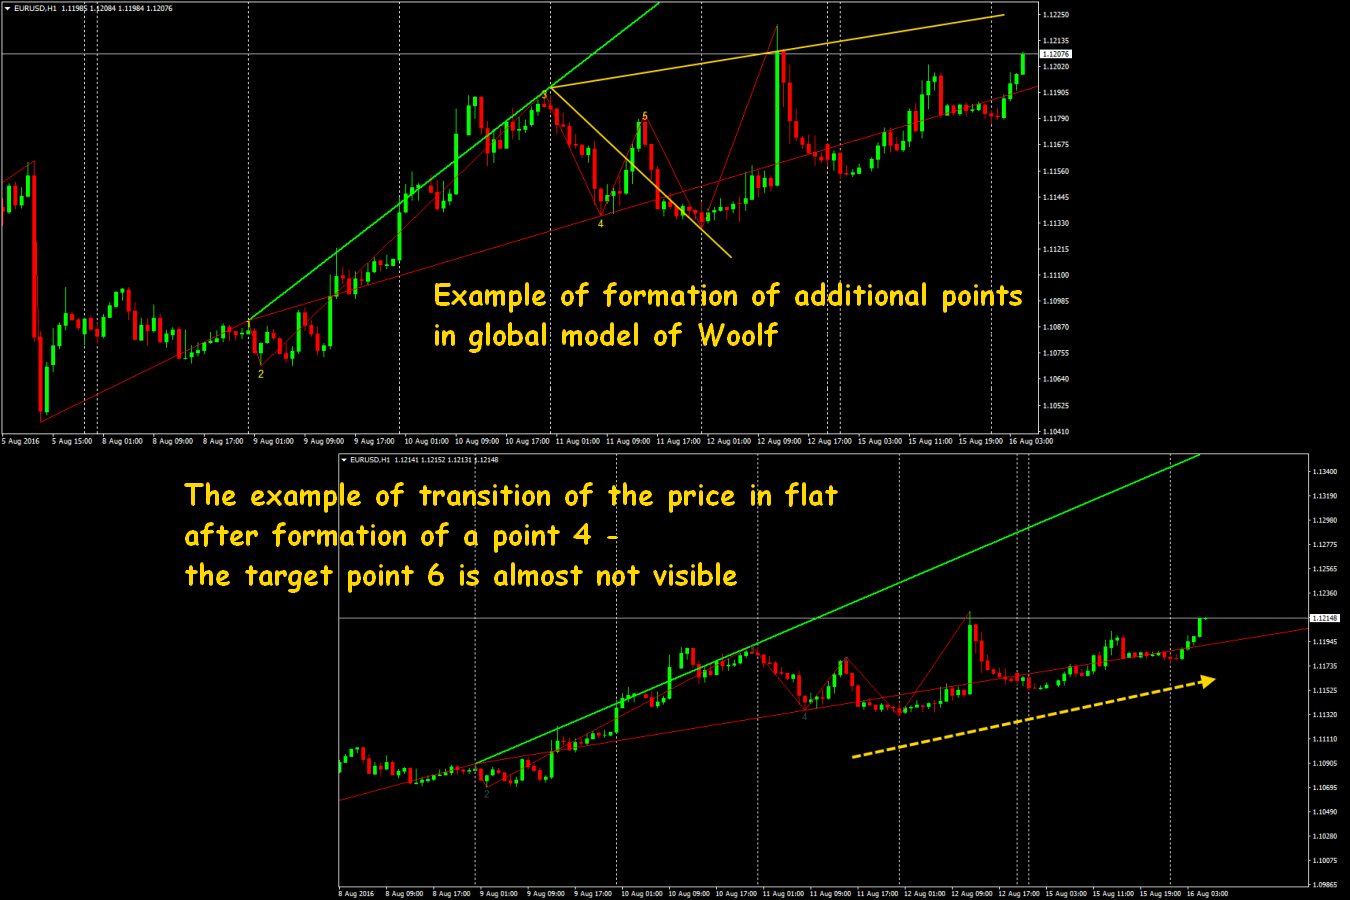
Example 3. Sometimes the price goes to quite long flat after normal forming of the fourth wave. In attempts to adjust lines of the purposes among a heap of «tops» becomes difficult to find a true fourth point, of course, it will be also difficult to determine a target point 6. Then it`s better to build two lines of the purpose and in the case when the price reaches the first level, to execute creations again and to analyze a further market behavior. If there is a breakthrough, then the continuation of a wave 6 is quite probable, and in the case of a turn, it is worth being closed from this line or, at least, to tighten stop.
For example, on the scheme above all points 6 which were on the line 1-4 have been fulfilled, but it could not occur. If there is no confidence in an ultimate goal, it will be logical on each point of a contact of the line 1-4 to close a position partially and to move the stop after each contact of the line 1-4. But after achievement of a point 6, all positions are surely closed because of the probability of continuation or a breakthrough is 50%.
Some words about global benefits and shortcomings
The problem of the wave theory is what would become its main benefit: it tries to consider the human psychology of market behavior.
You shouldn't forget, the result of the estimation depends very much on the accuracy of determination of key points for Woolf's patterns, as well as for all graphical models. This is a very subjective decision which is the result of personal observation of each trader – each wave trader sees in the market only what he wants to see and calculates waves differently.
Waves are visible very well on history but are badly forecasting. Graphical patterns are the «ideal models», and you shouldn't expect that the price will always behave according to the tough scenario, determined by you. For this reason, wave traders have nothing to do on small time frames where one unexpected news breaks all calculations, though such heroes meet too.
The main advantage of the general wave theory (and Woolf's Waves − as his parts) is it studies, analyzes and works with net price, but not with its derivatives (for instance, settlement data of indicators). Besides, all elements of the wave analysis are closely connected with Fibonacci's numbers and the connection with the indicator of the same name gives very stable signals. Woolf's patterns give an accurate definition of an algorithm of the behavior of the price (what is it − an impulse or correction), rather the exact determination of the purposes of pulse and correctional movement, and also points of trend turns.
And as the conclusion …
The global wave models are fulfilled slowly practically on all assets, at least, on medium-term, and rather wide experience requires for their correct analysis. Woolf`s graphical creations may be applied to any assets (including shares and CFD), but on the quickly foreign exchange markets it gives the maximum benefit. The risk of a mistake in the case of creations because of unstable volatility increases too, of course.
Woolf's patterns are the most profitable models, meet on all the time frames and in the case of the correct creation, it is possible to trade successfully both on a full-fledged turn of a trend and on an entrance on a trend after essential corrections. But all models of continuation, according to the statistics of the wave analysis, have a much bigger probability of fulfillment, therefore, the stable result is yielded by trade on a trend. So you shouldn't ignore the analysis on the senior periods. Of course, as well as for all graphic approaches, Woolf's Waves require sure technical skills.
Because of the simplified technique, the Woolf`s Waves allow working with several trade assets at the same time and on the identical periods. Basic waves are quite suitable as a basic element of any medium-term strategy and even if to consider ideal models are practically not formed, then in a combination with complex trend tools (for instance, Ichimoku), Elliott's waves (of course!), Murray`s or Fibonacci's levels you may gain profit effectively even by non-optimal Woolf`s price constructions.
Social button for Joomla